Without knowing exactly why a system is slow there is a temptation to use the “it could be this” approach — successively guessing at interventions which might fix the problem. Guessing is usually a waste of time when it comes to any optimization work. ⤴️
Once we have identified the main performance problems, being able to solve these is a matter of understanding the system (software and hardware) deeply enough and using the right tool for the job. ⤴️
We can begin tracing without any changes to application code — as simple as this:
$ nsys profile -t cuda,cudnn,nvtx,osrt -o
This will produce a report at “ which can be loaded and analyzed using the Nsight Systems desktop client. ⤴️
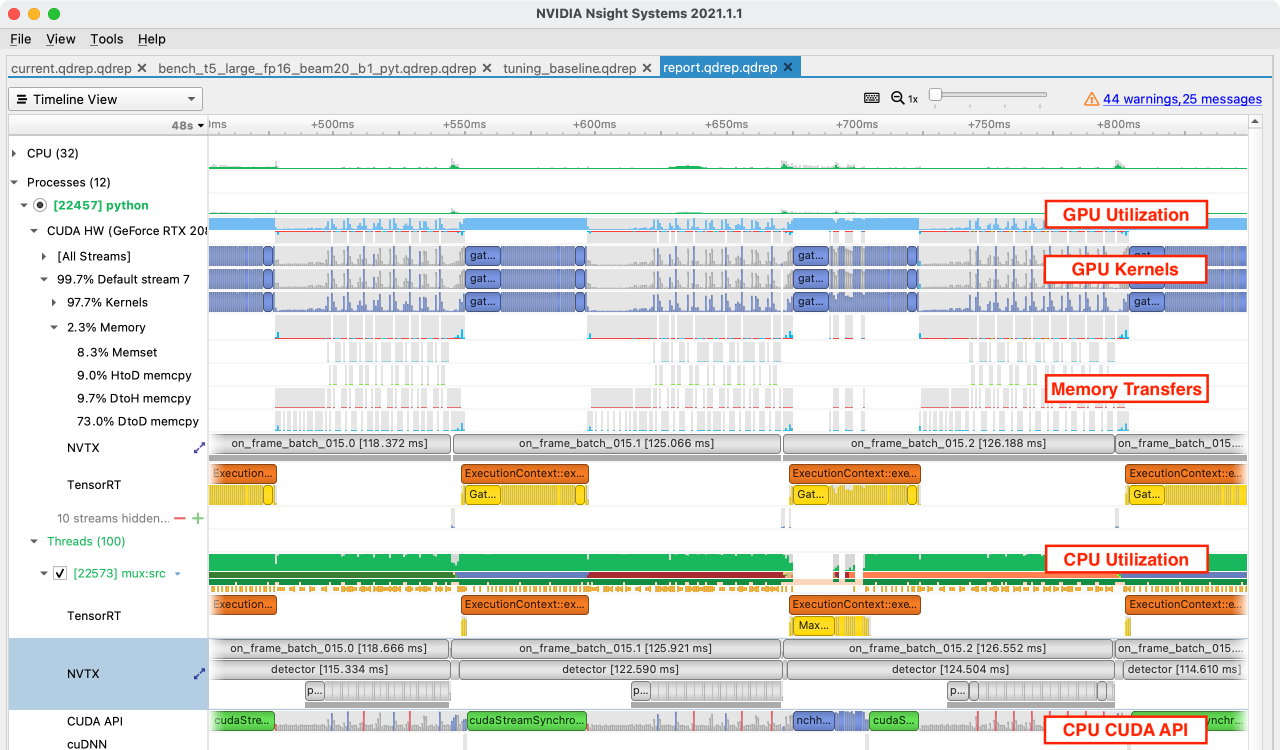
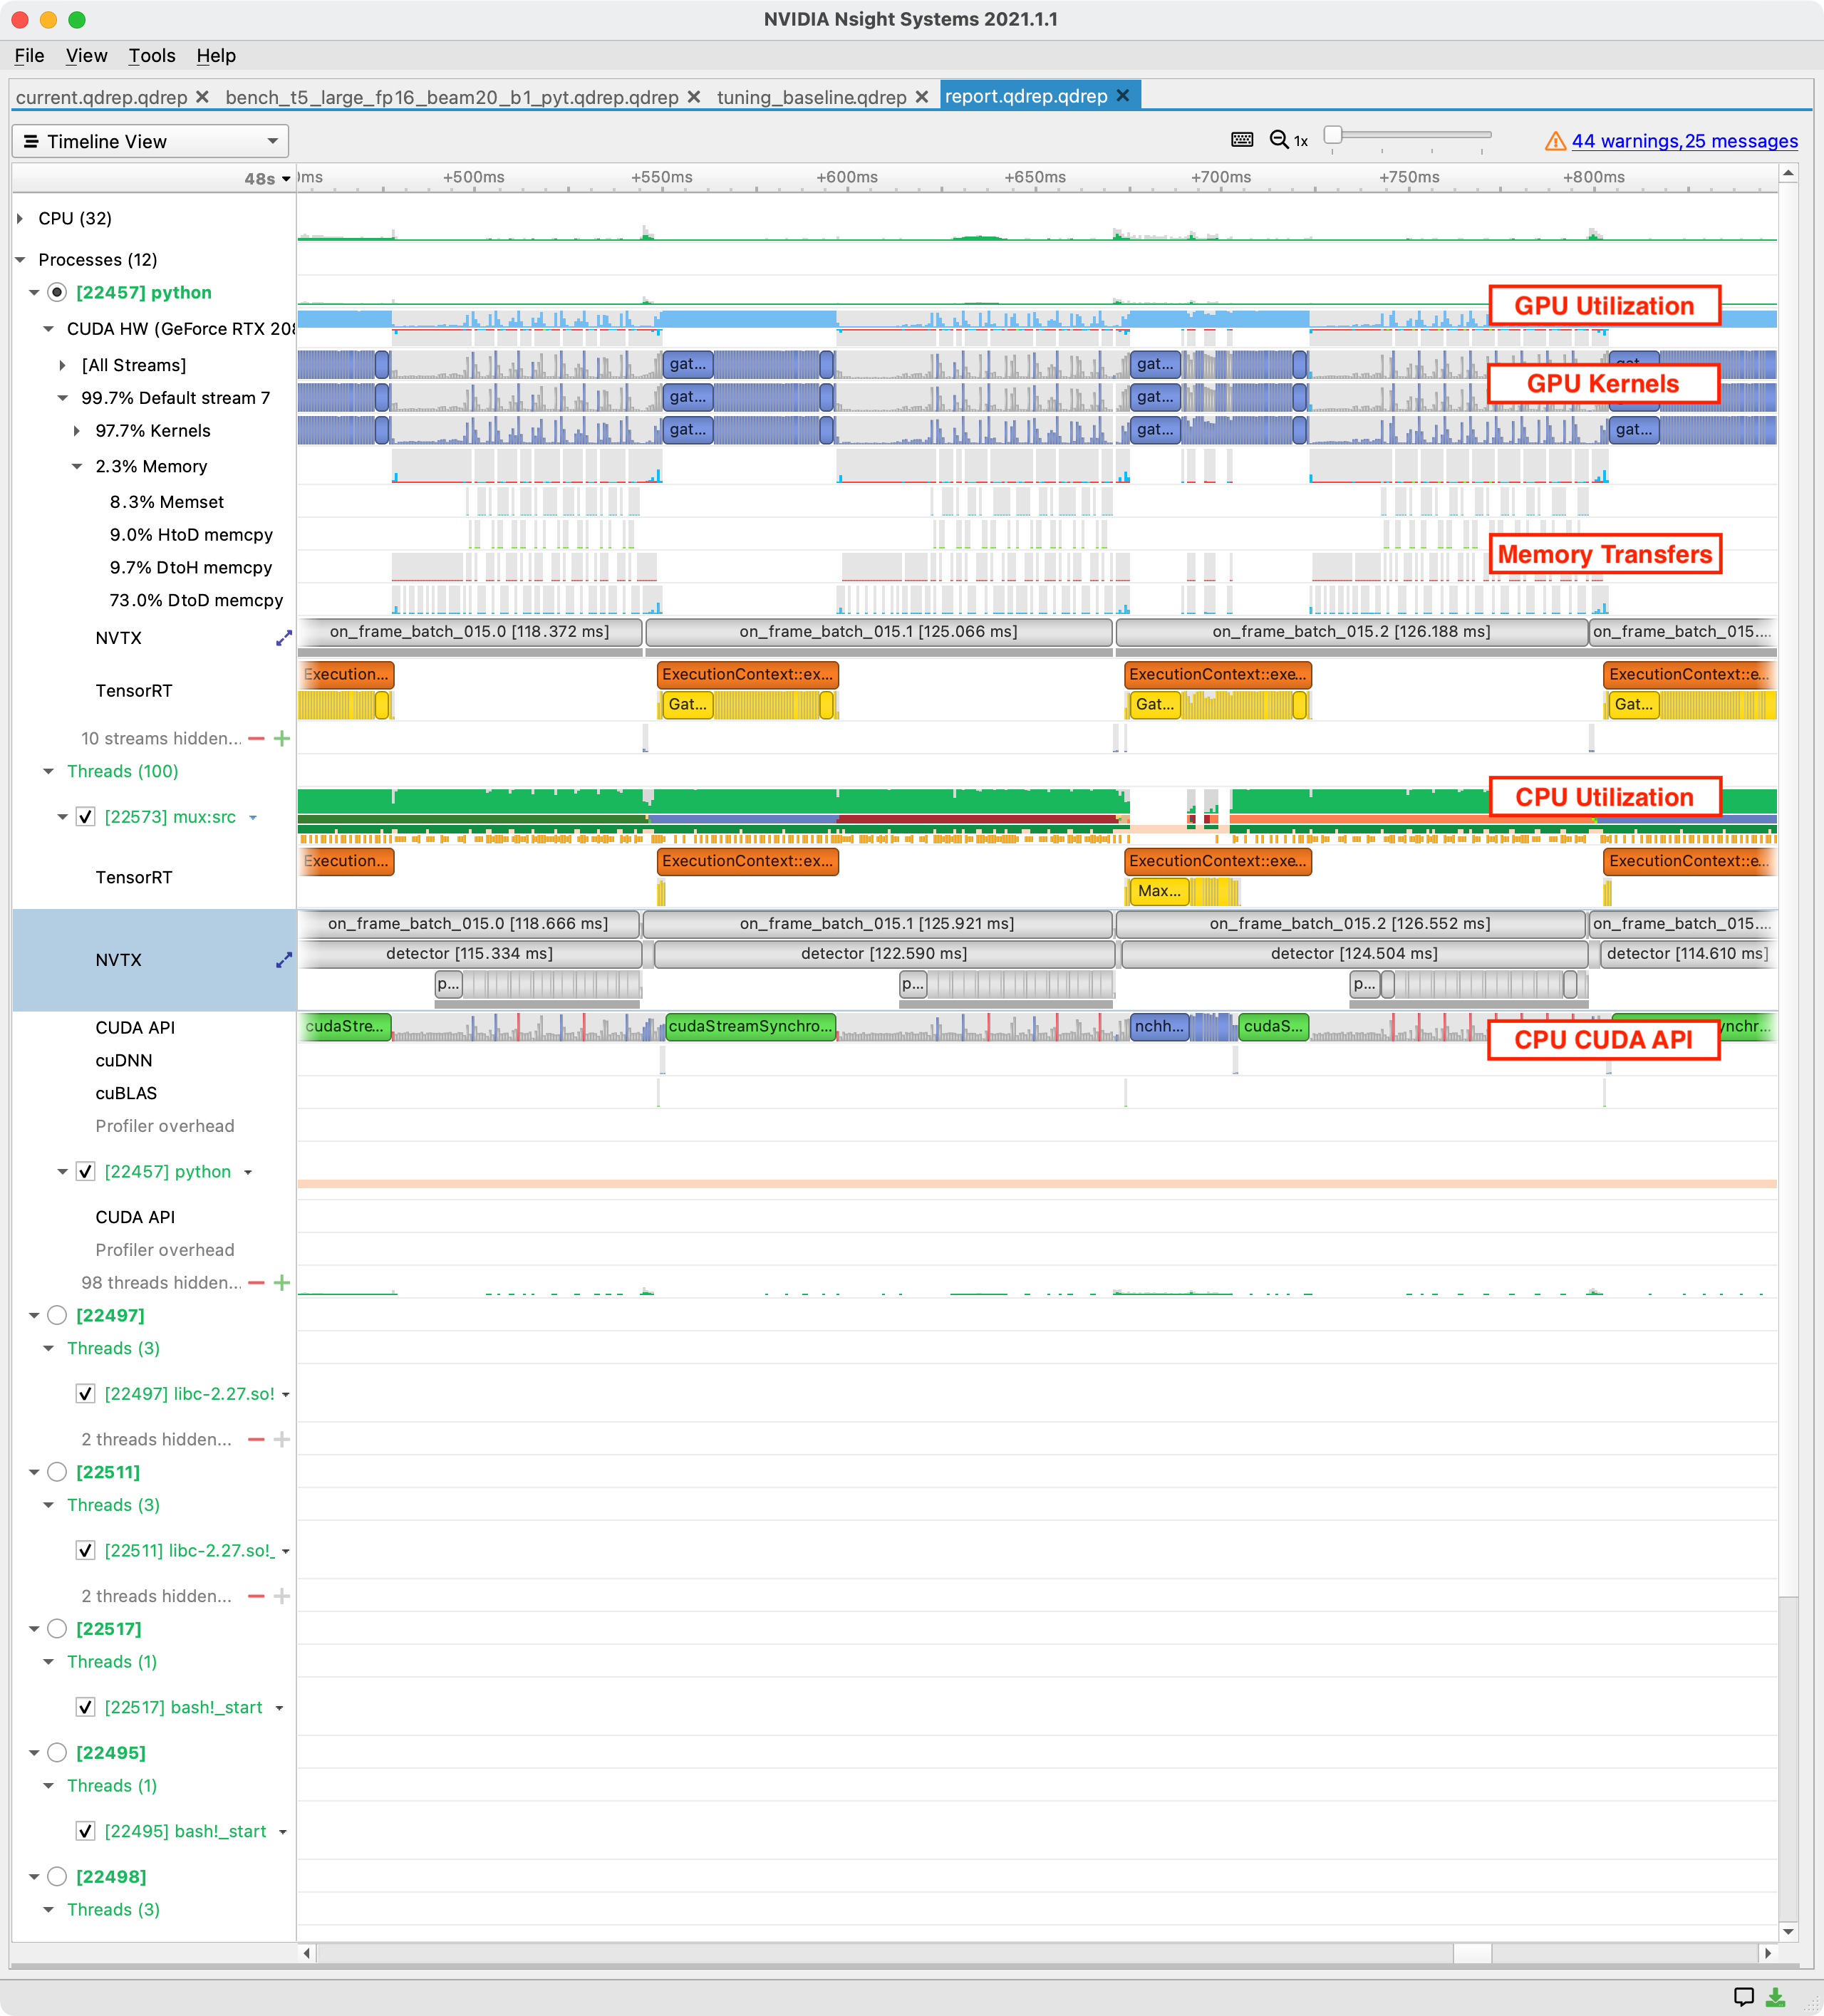
Looking at this sample Nsight Systems report, we can see several important features:
Traces of aggregated resource consumption over time (GPU and CPU utilization) tell us generally where to focus.
Ranges in several tracks corresponding to on-device kernel executions, memory transfers, synchronization activity, and host CUDA API calls.
Activity is split into traces for any GPUs, and also for the host where it is subdivided by threads. ⤴️
Using NVTX we can easily delineate logical sections of model code and these appear as highly precise ranges in Nsight Systems traces. Viewing resource consumption metrics and low-level operations (CUDA kernels, memory transfers, synchronization points) alongside your logical ranges allows us to deeply understand execution performance.
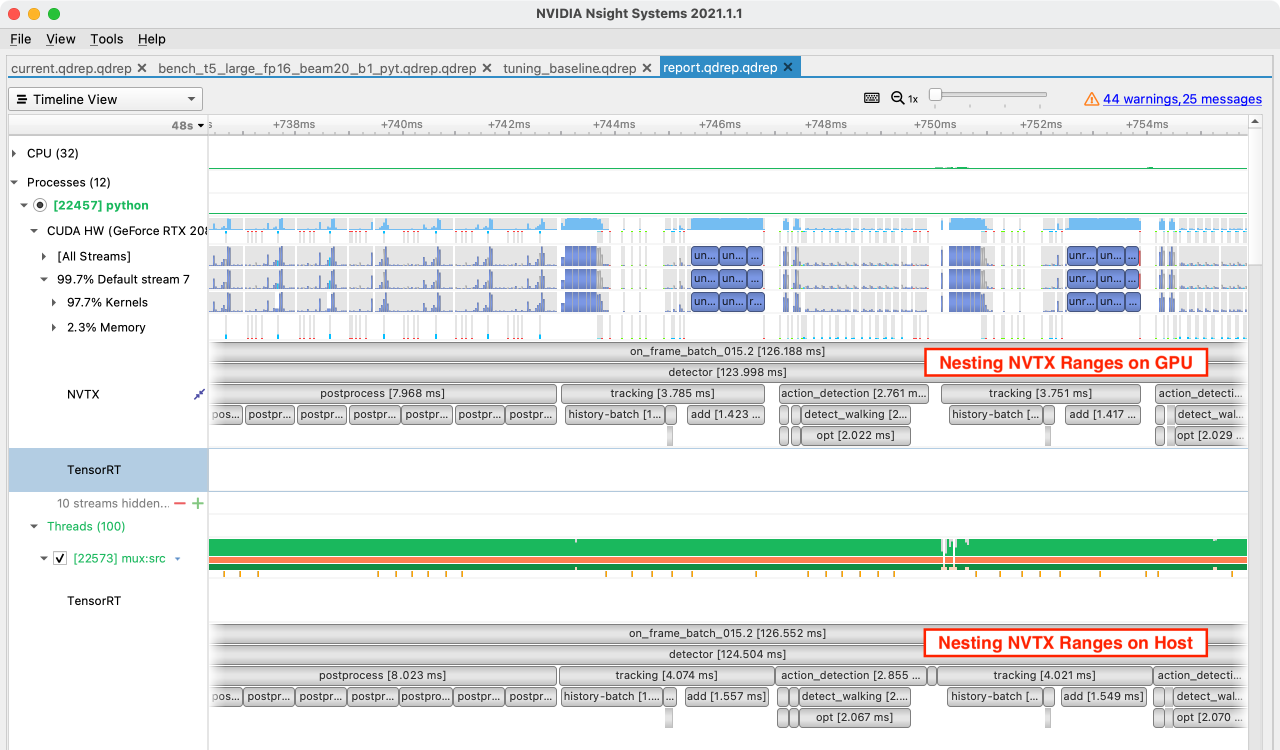
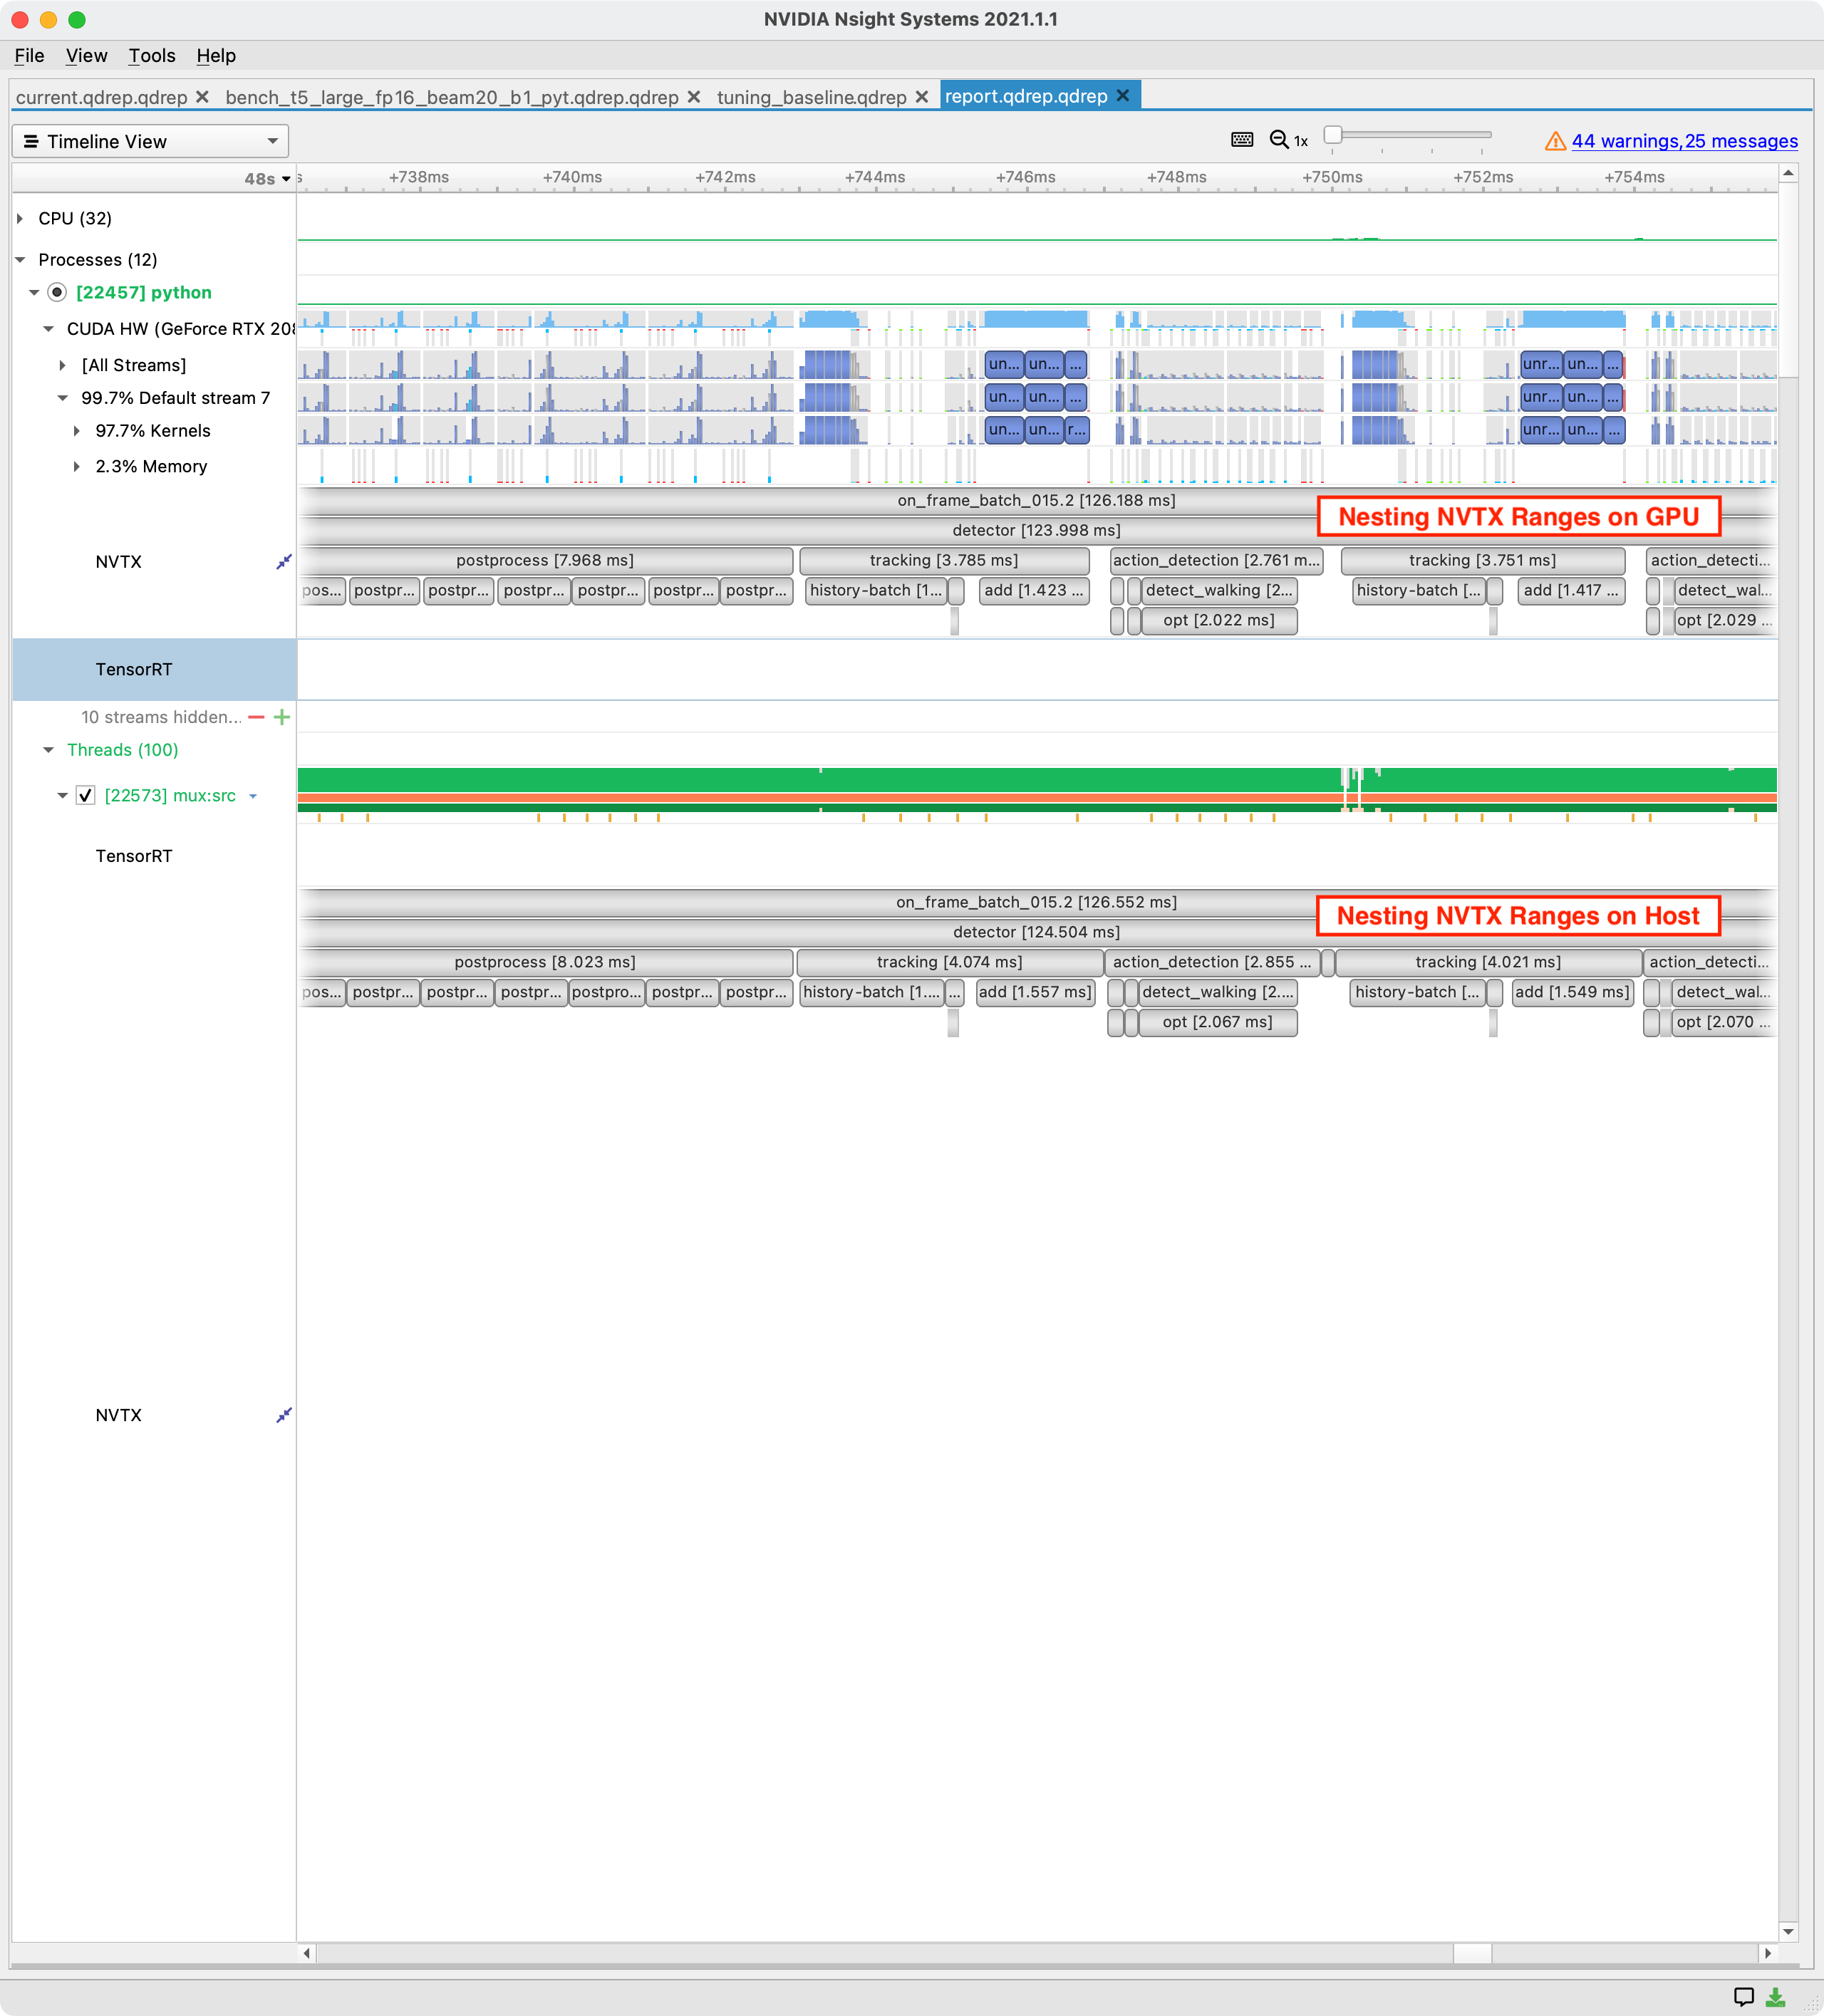
NVTX Ranges on Host and Device May Not Match, but Both Are Correct
The host submits work via a command queue to the GPU for execution. Due to this asynchronous relationship the start of an NVTX range in the host process will often be well before the start of that range on the GPU. ⤴️
The devices (GPUs) in a system behave like very powerful asynchronous coprocessors. The host (CPU) submits fully-specified chunks of work into a queue and the device performs these operations asynchronously and independently, only returning results to the host when requested via a memory transfer. ⤴️
Given this asynchronous relationship, the significant latency in host/device communication, and the fact that the device is far more powerful than the host in raw compute terms, some guidelines become clear:
Do as much work on the device as possible.
Work hard to remove synchronization points between host and device, as these can leave either side idle.
If possible, reduce communication (API calls and memory transfers) between host and device by batching or combining operations. ⤴️
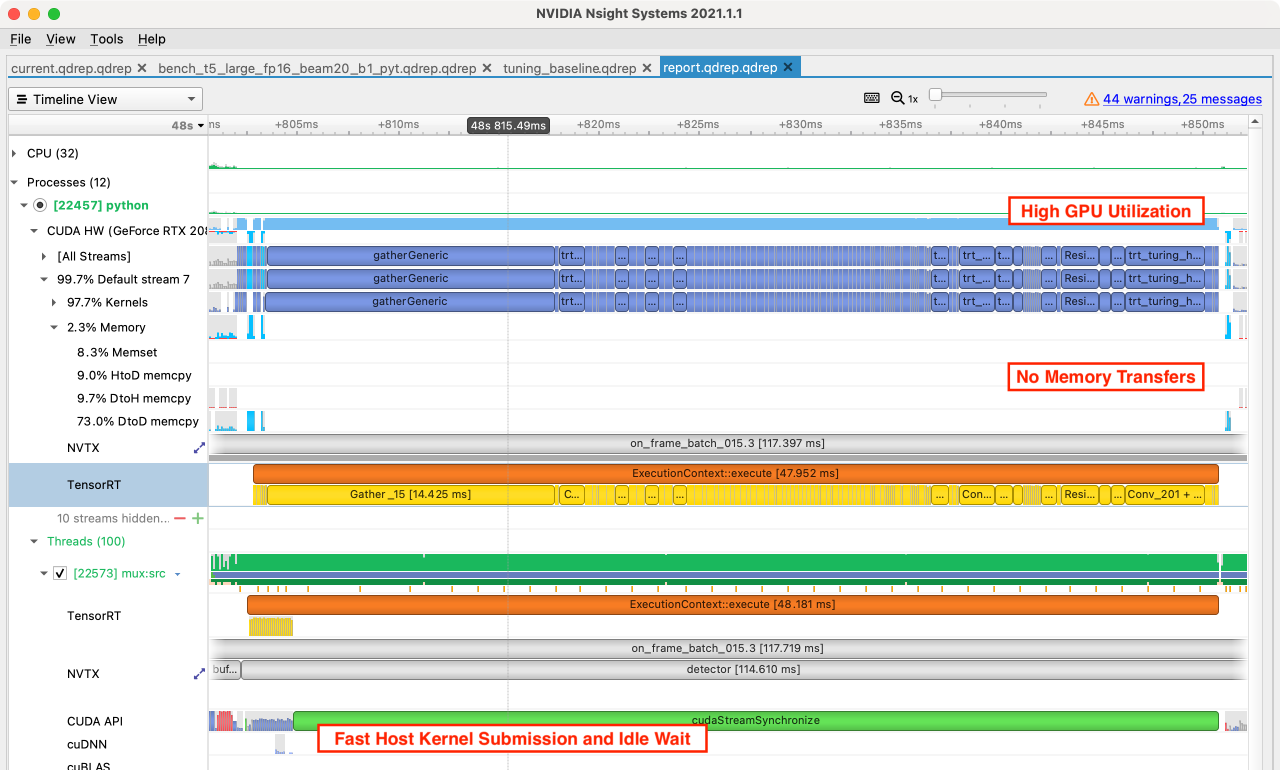
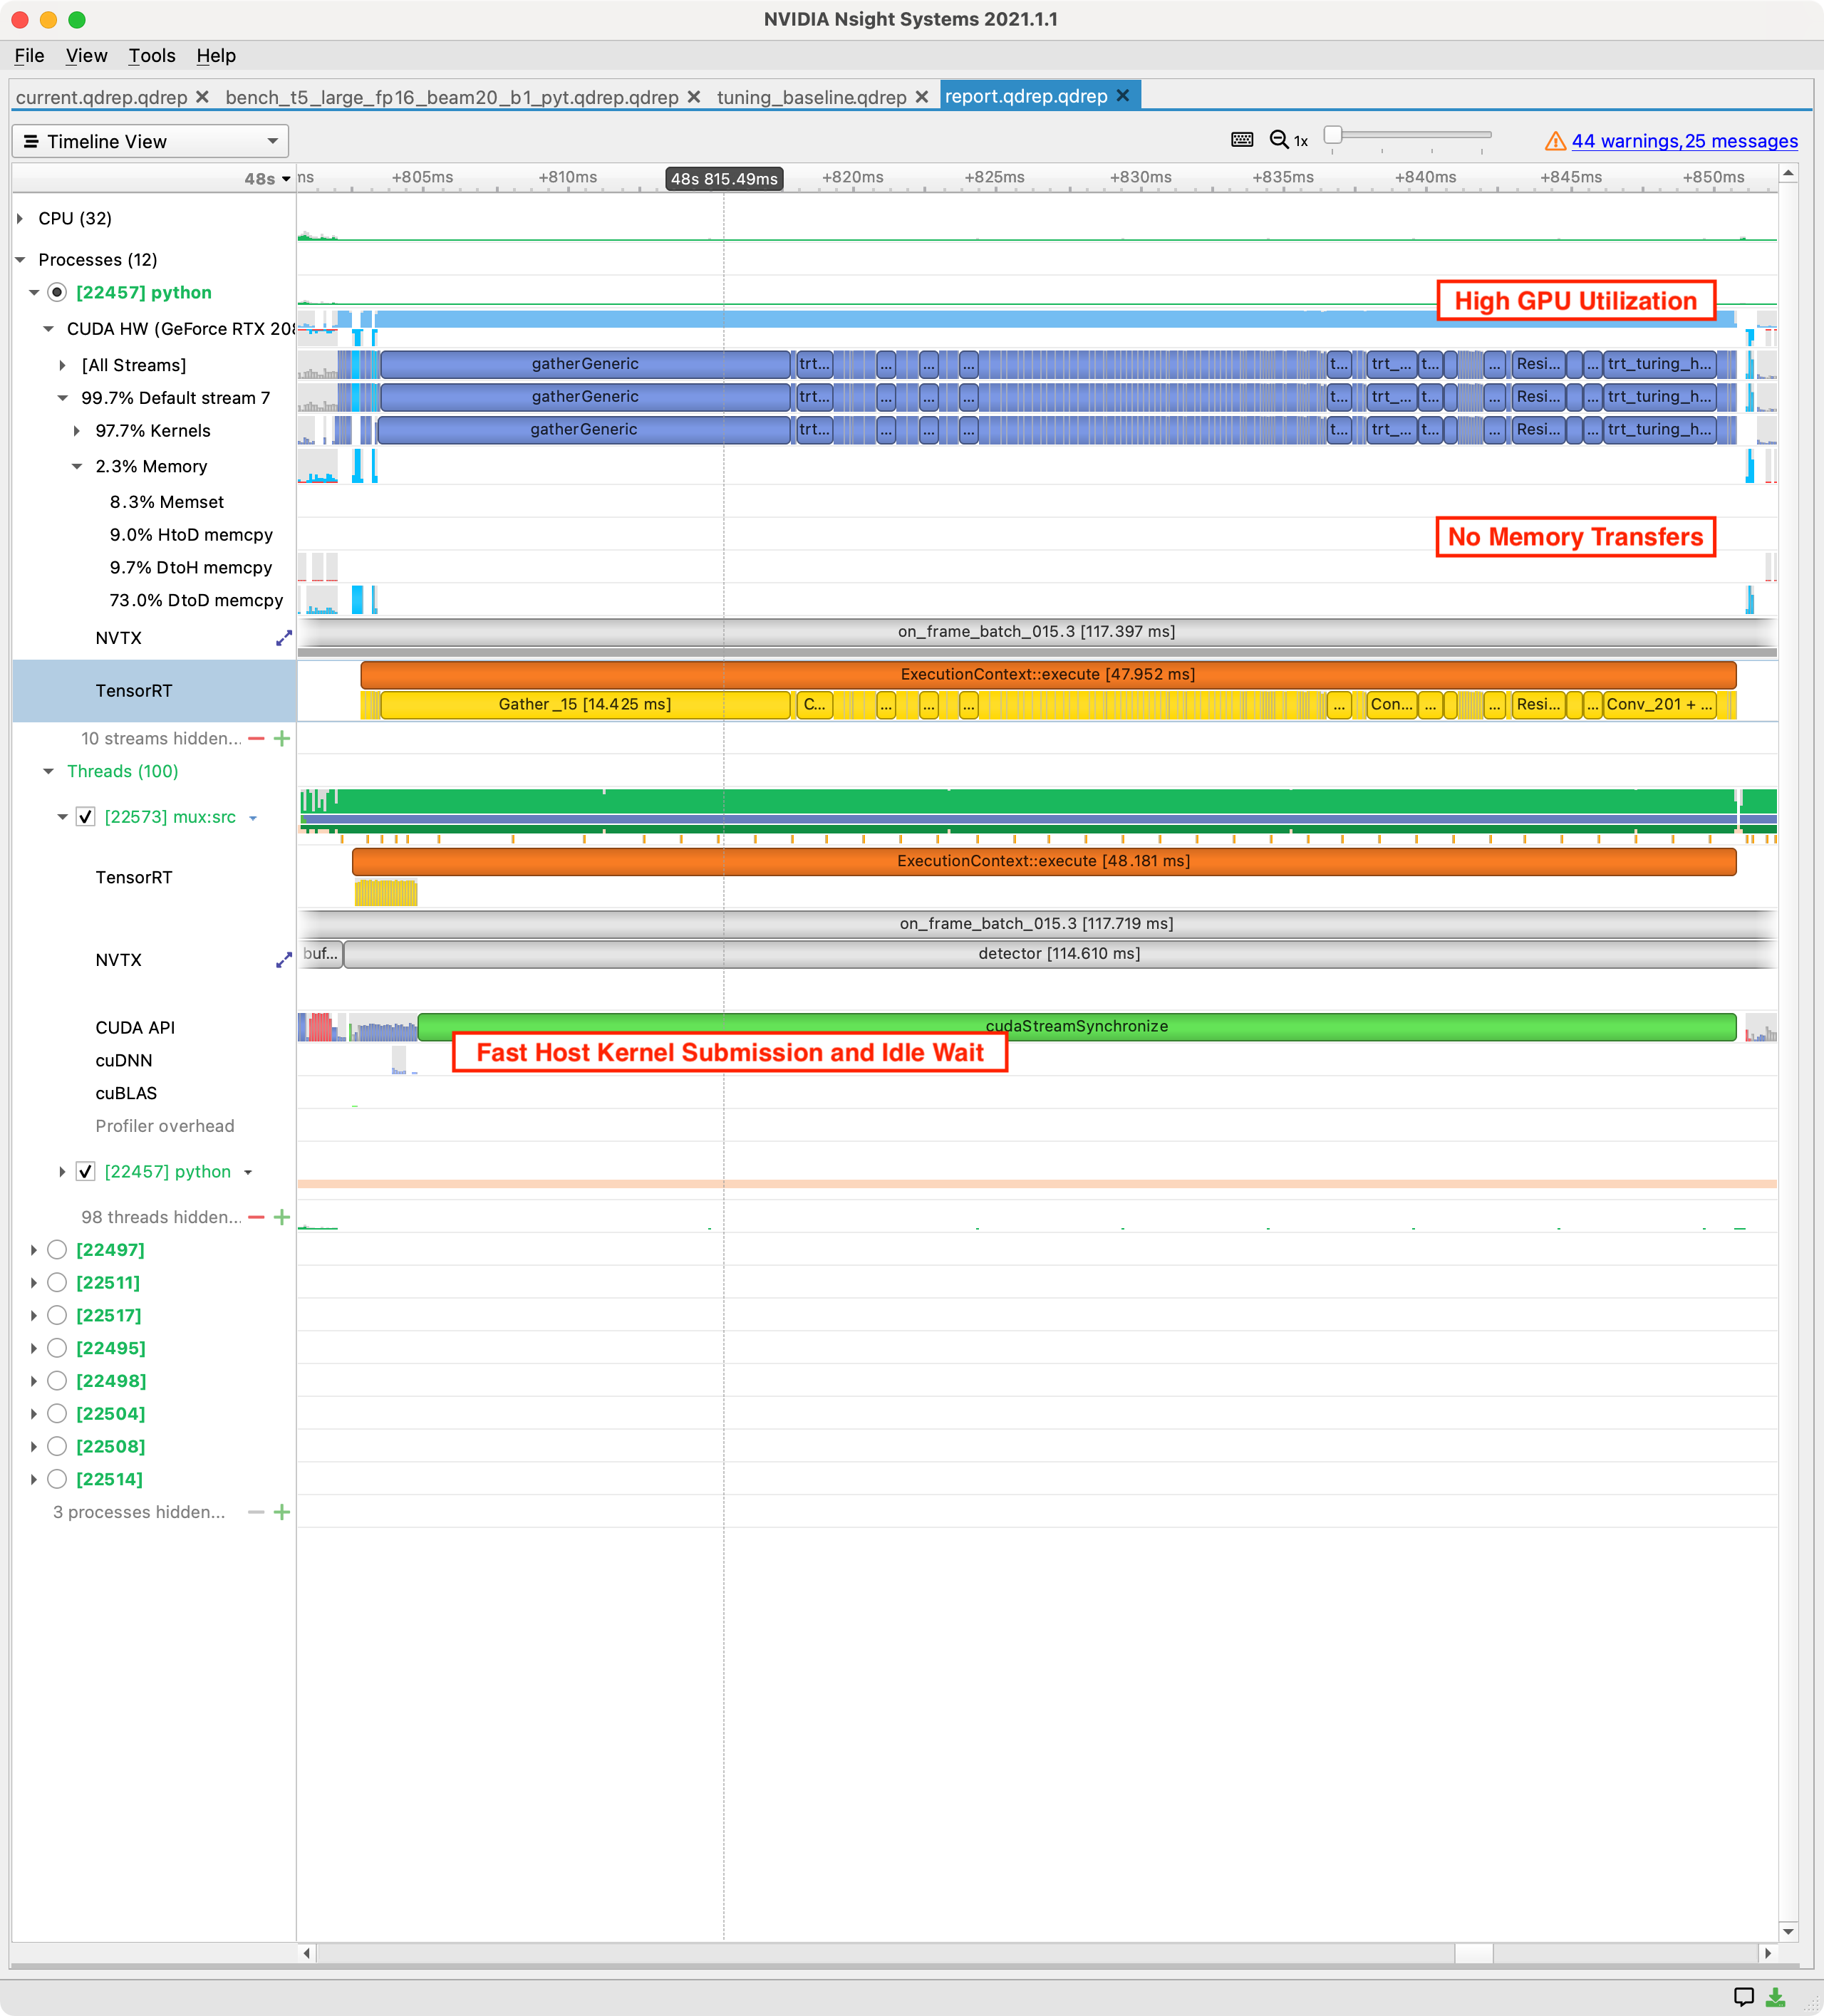
In this pattern, the GPU is continually running CUDA kernels corresponding to tensor transformations, activation functions, weight multiplications etc. These operations are being enqueued by the host faster than the GPU can execute them, so the GPU is able to stay at high utilization. In this state, a less fine-grained tool like nvidia-smi would show >90% GPU utilization.
GPU utilization resource trace shows >90%, without gaps, and kernels are executed sequentially without delays.
GPU memory transfers are absent or rare, especially DtoH or HtoD transfers.
Host CUDA API trace shows kernels being submitted faster than the GPU completes them, and includes waiting time for synchronization. ⤴️
this pattern is a good one to see. It means you are using your most expensive hardware with high utilization and you are avoiding the very common pitfall of mixing CPU and GPU computation together. However, if a large portion of your run time is GPU compute bound then this represents a good opportunity for optimization. ⤴️
Use a lower-precision version of your model: float16 or even int8 quantization can give up to 2x or 4x improvements in throughput.
Use a profiling-based model compiler like TensorRT: this will fuse layers, use optimized kernels, and determine optimal kernel launch parameters for your specific hardware.
Perform model-pruning using a framework like the Transfer Learning Toolkit (TLT): reduce the number of computations performed with a small impact to accuracy.
Use more powerful GPUs: spending more money is usually not the goal, however this is the only trace pattern where upgrading GPUs is a good choice. ⤴️
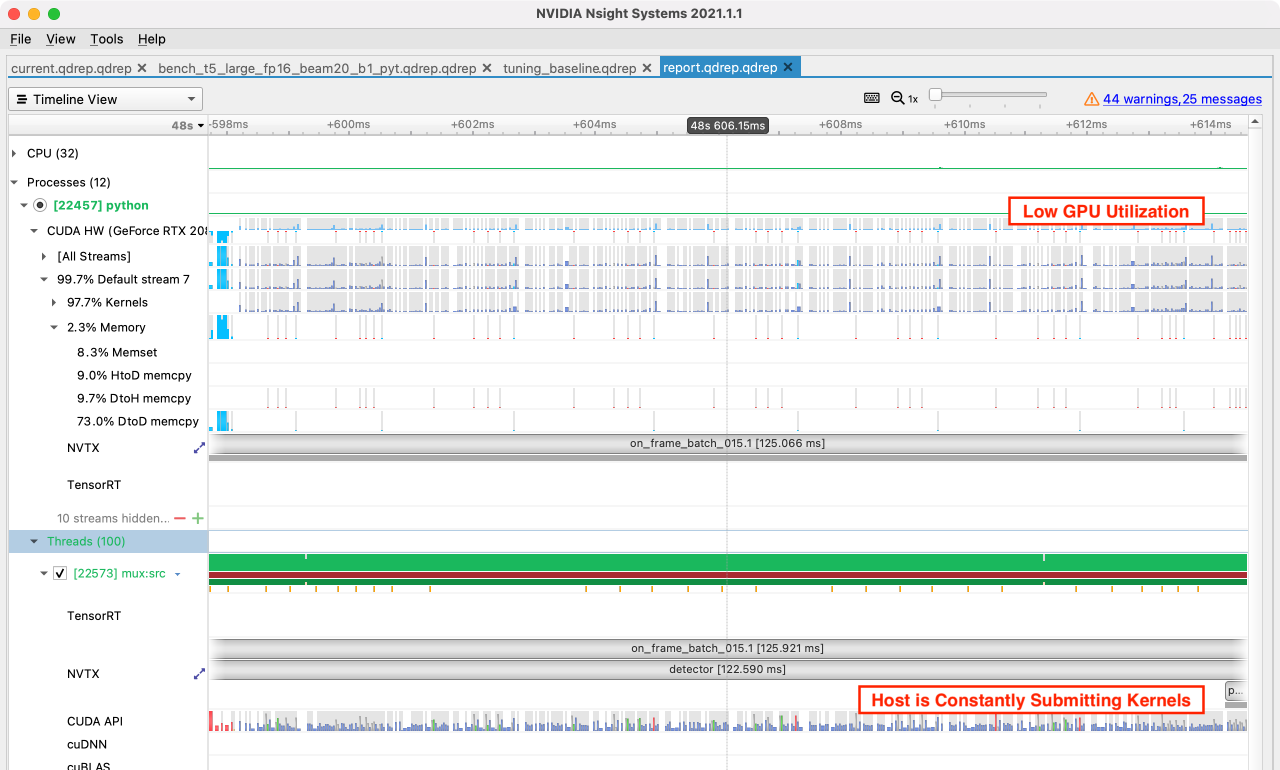
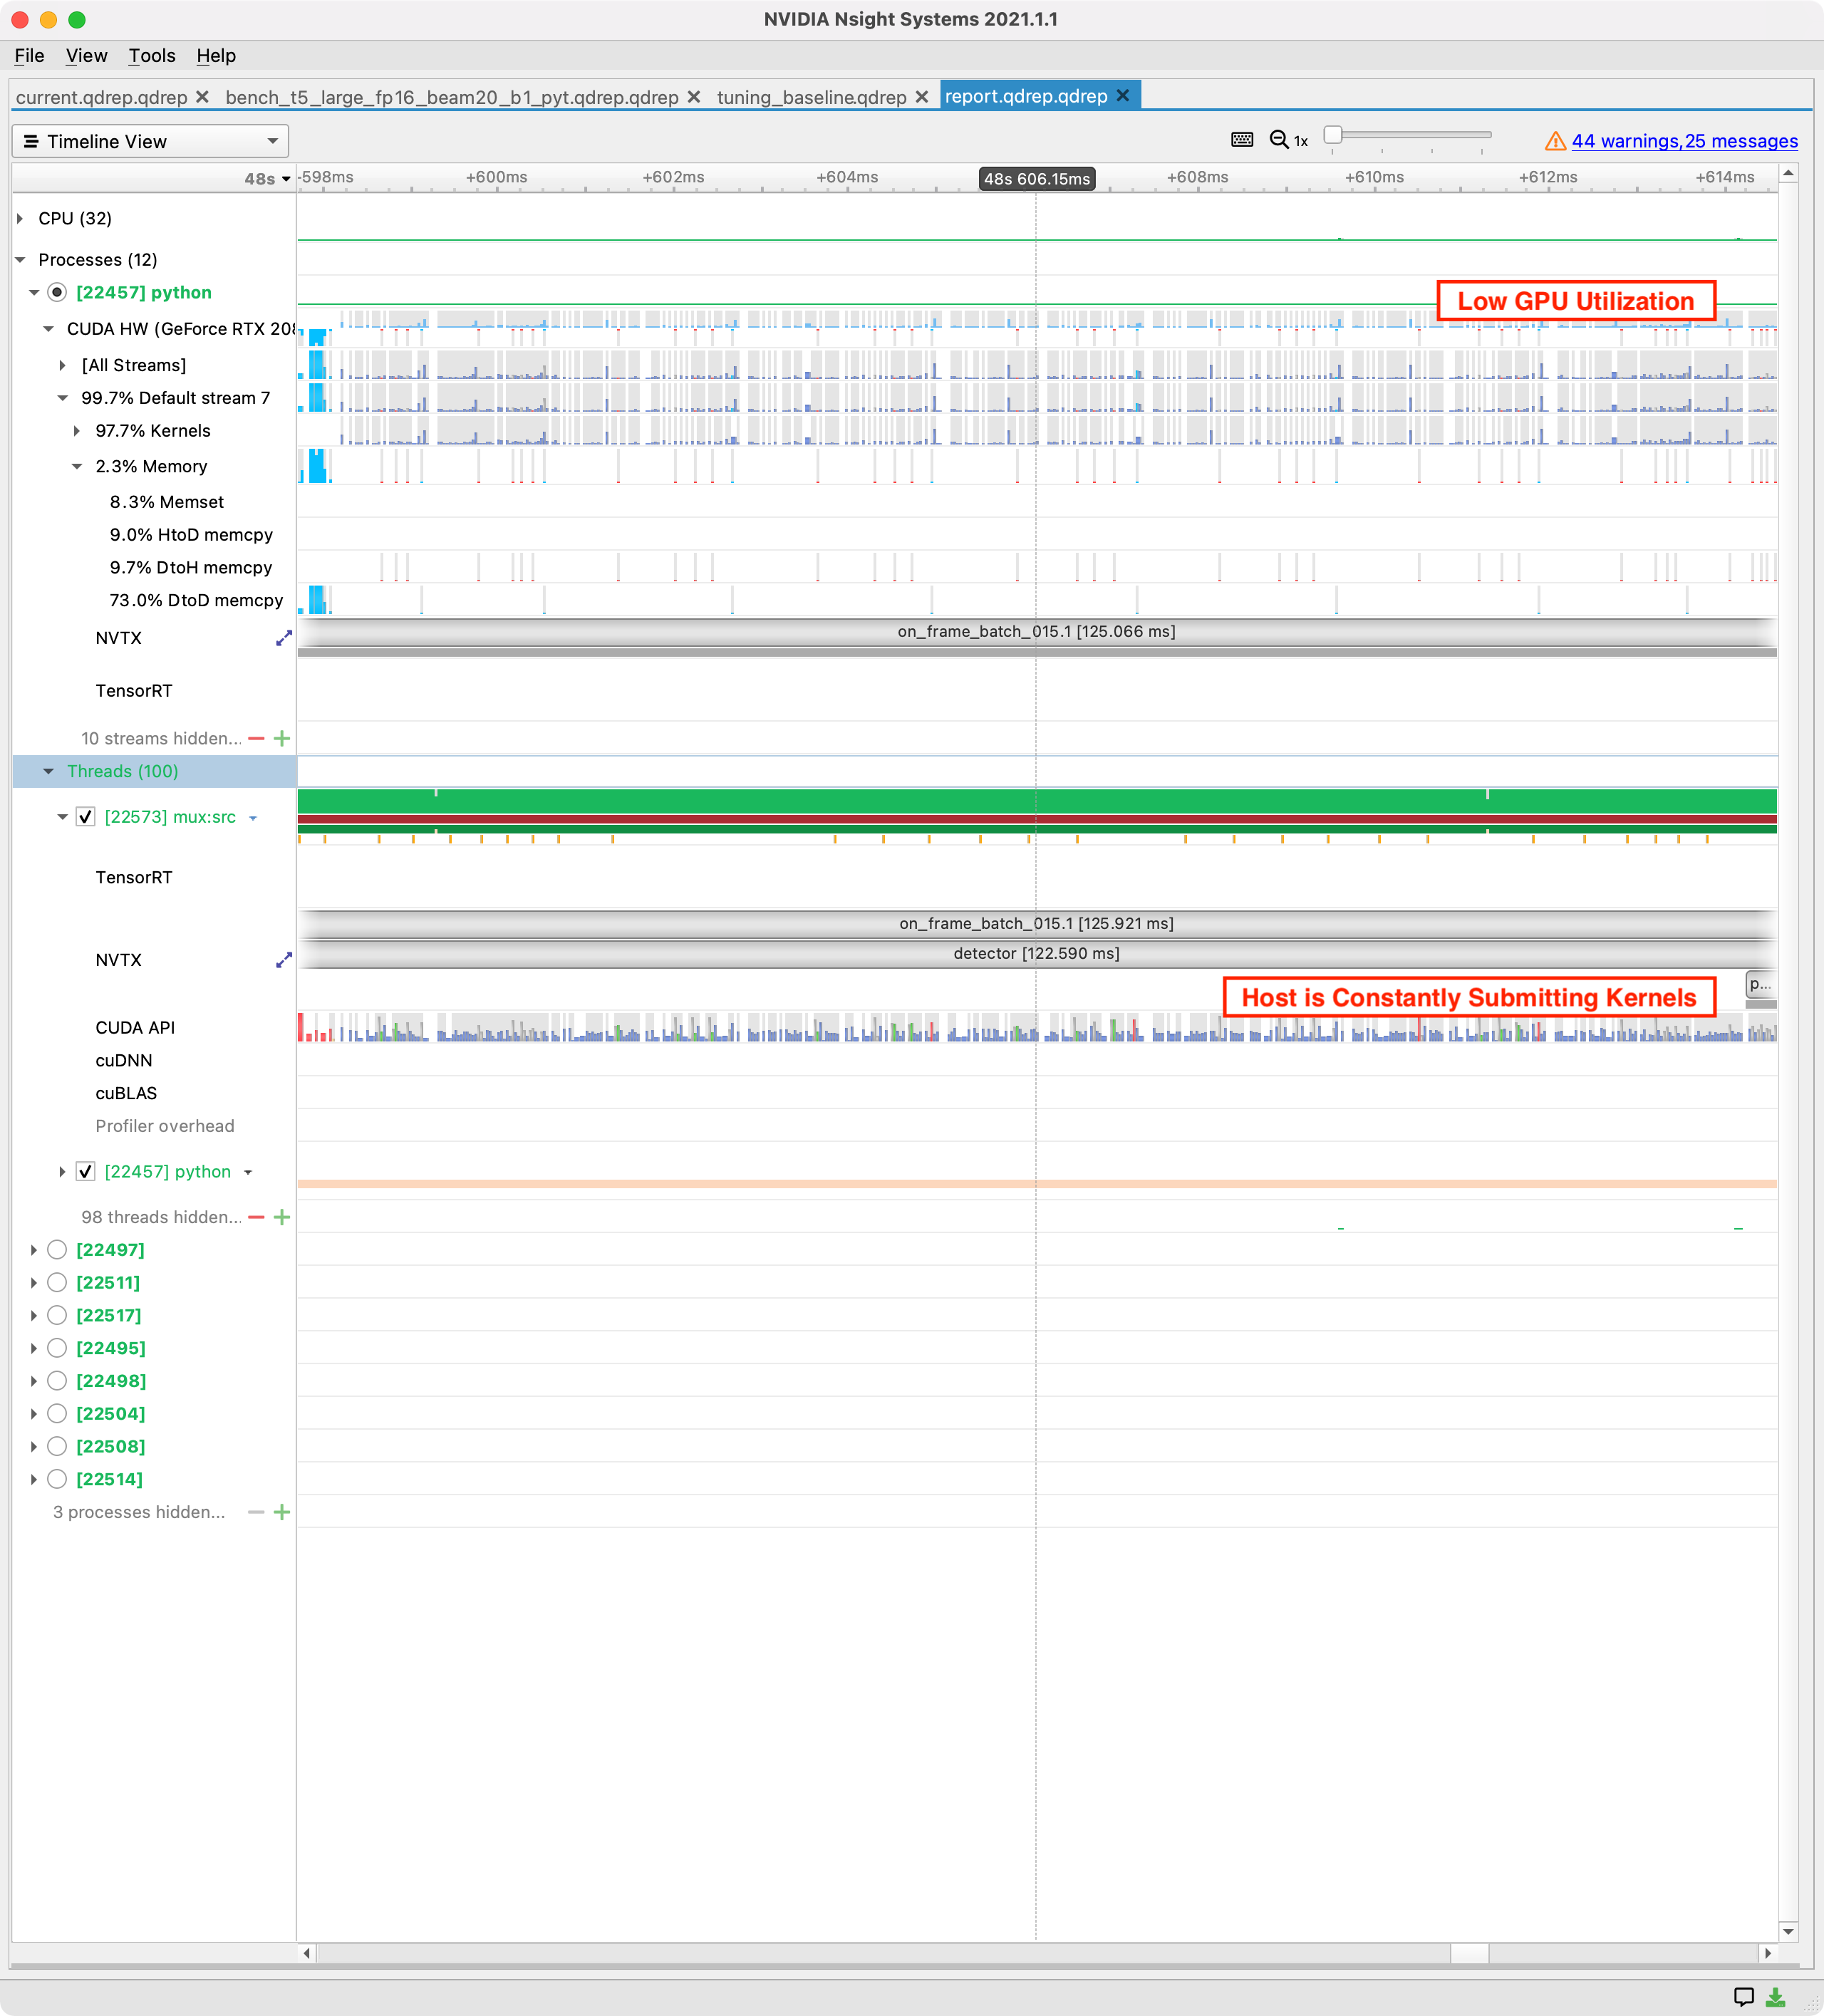
In terms of raw compute GPUs are surprisingly powerful and it is easy to get into a situation where your host/CPU is submitting work to the GPU as fast as possible but still cannot keep up. The CPU is constantly sending work into a non-blocking command queue, but the GPU finishes the work in less time than it takes to configure and enqueue. Unsurprisingly, this is much more likely to be a problem with a Python host process.
Improving performance when you are spending all your host time on submitting tensor operations can be very easy or very challenging, depending on whether your existing logic incorporates a batch dimension. If all processing is expressed in terms of a batch then increasing this batch dimension is a great way to shift the bottleneck from CPU to GPU.
If your current logic is expressed per item (frame by frame, for example) then you’ll probably need to think through every line of the code as you implement batching. On the positive side, the results of this kind of transformation can be very impressive and with the GPU now a bottleneck many further optimizations have been unlocked.
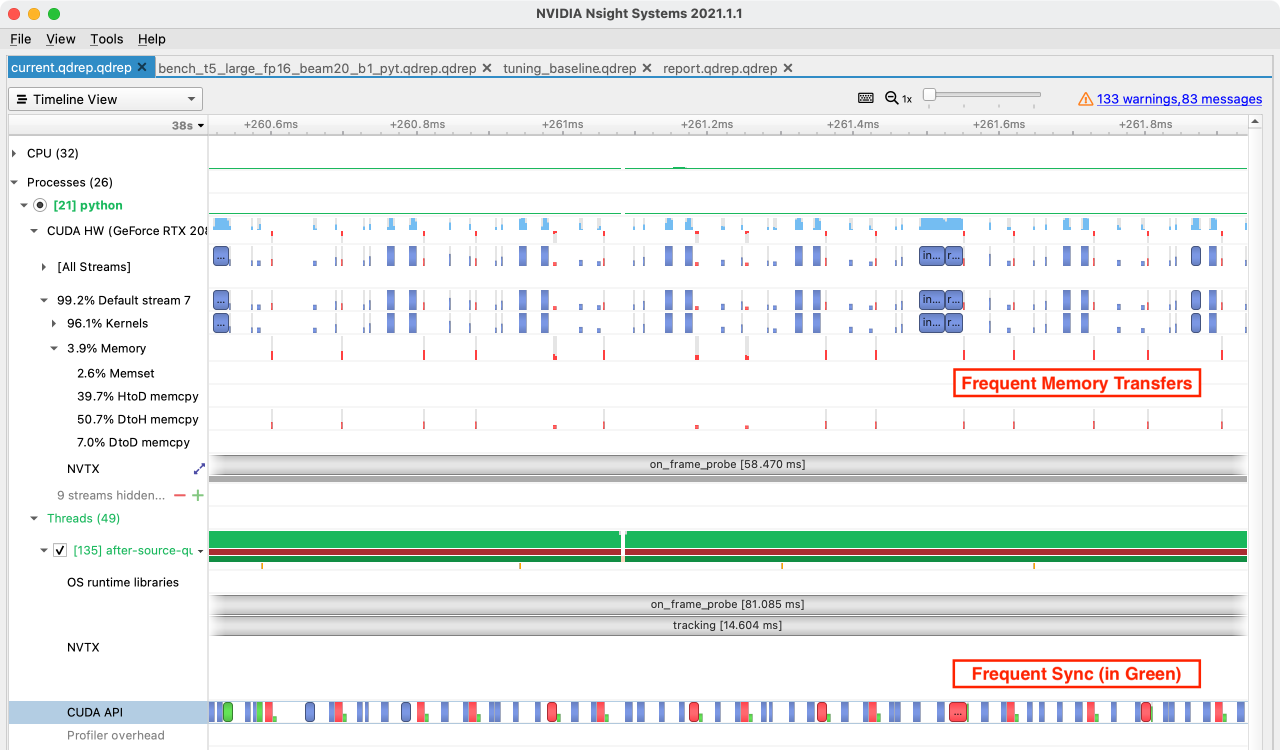
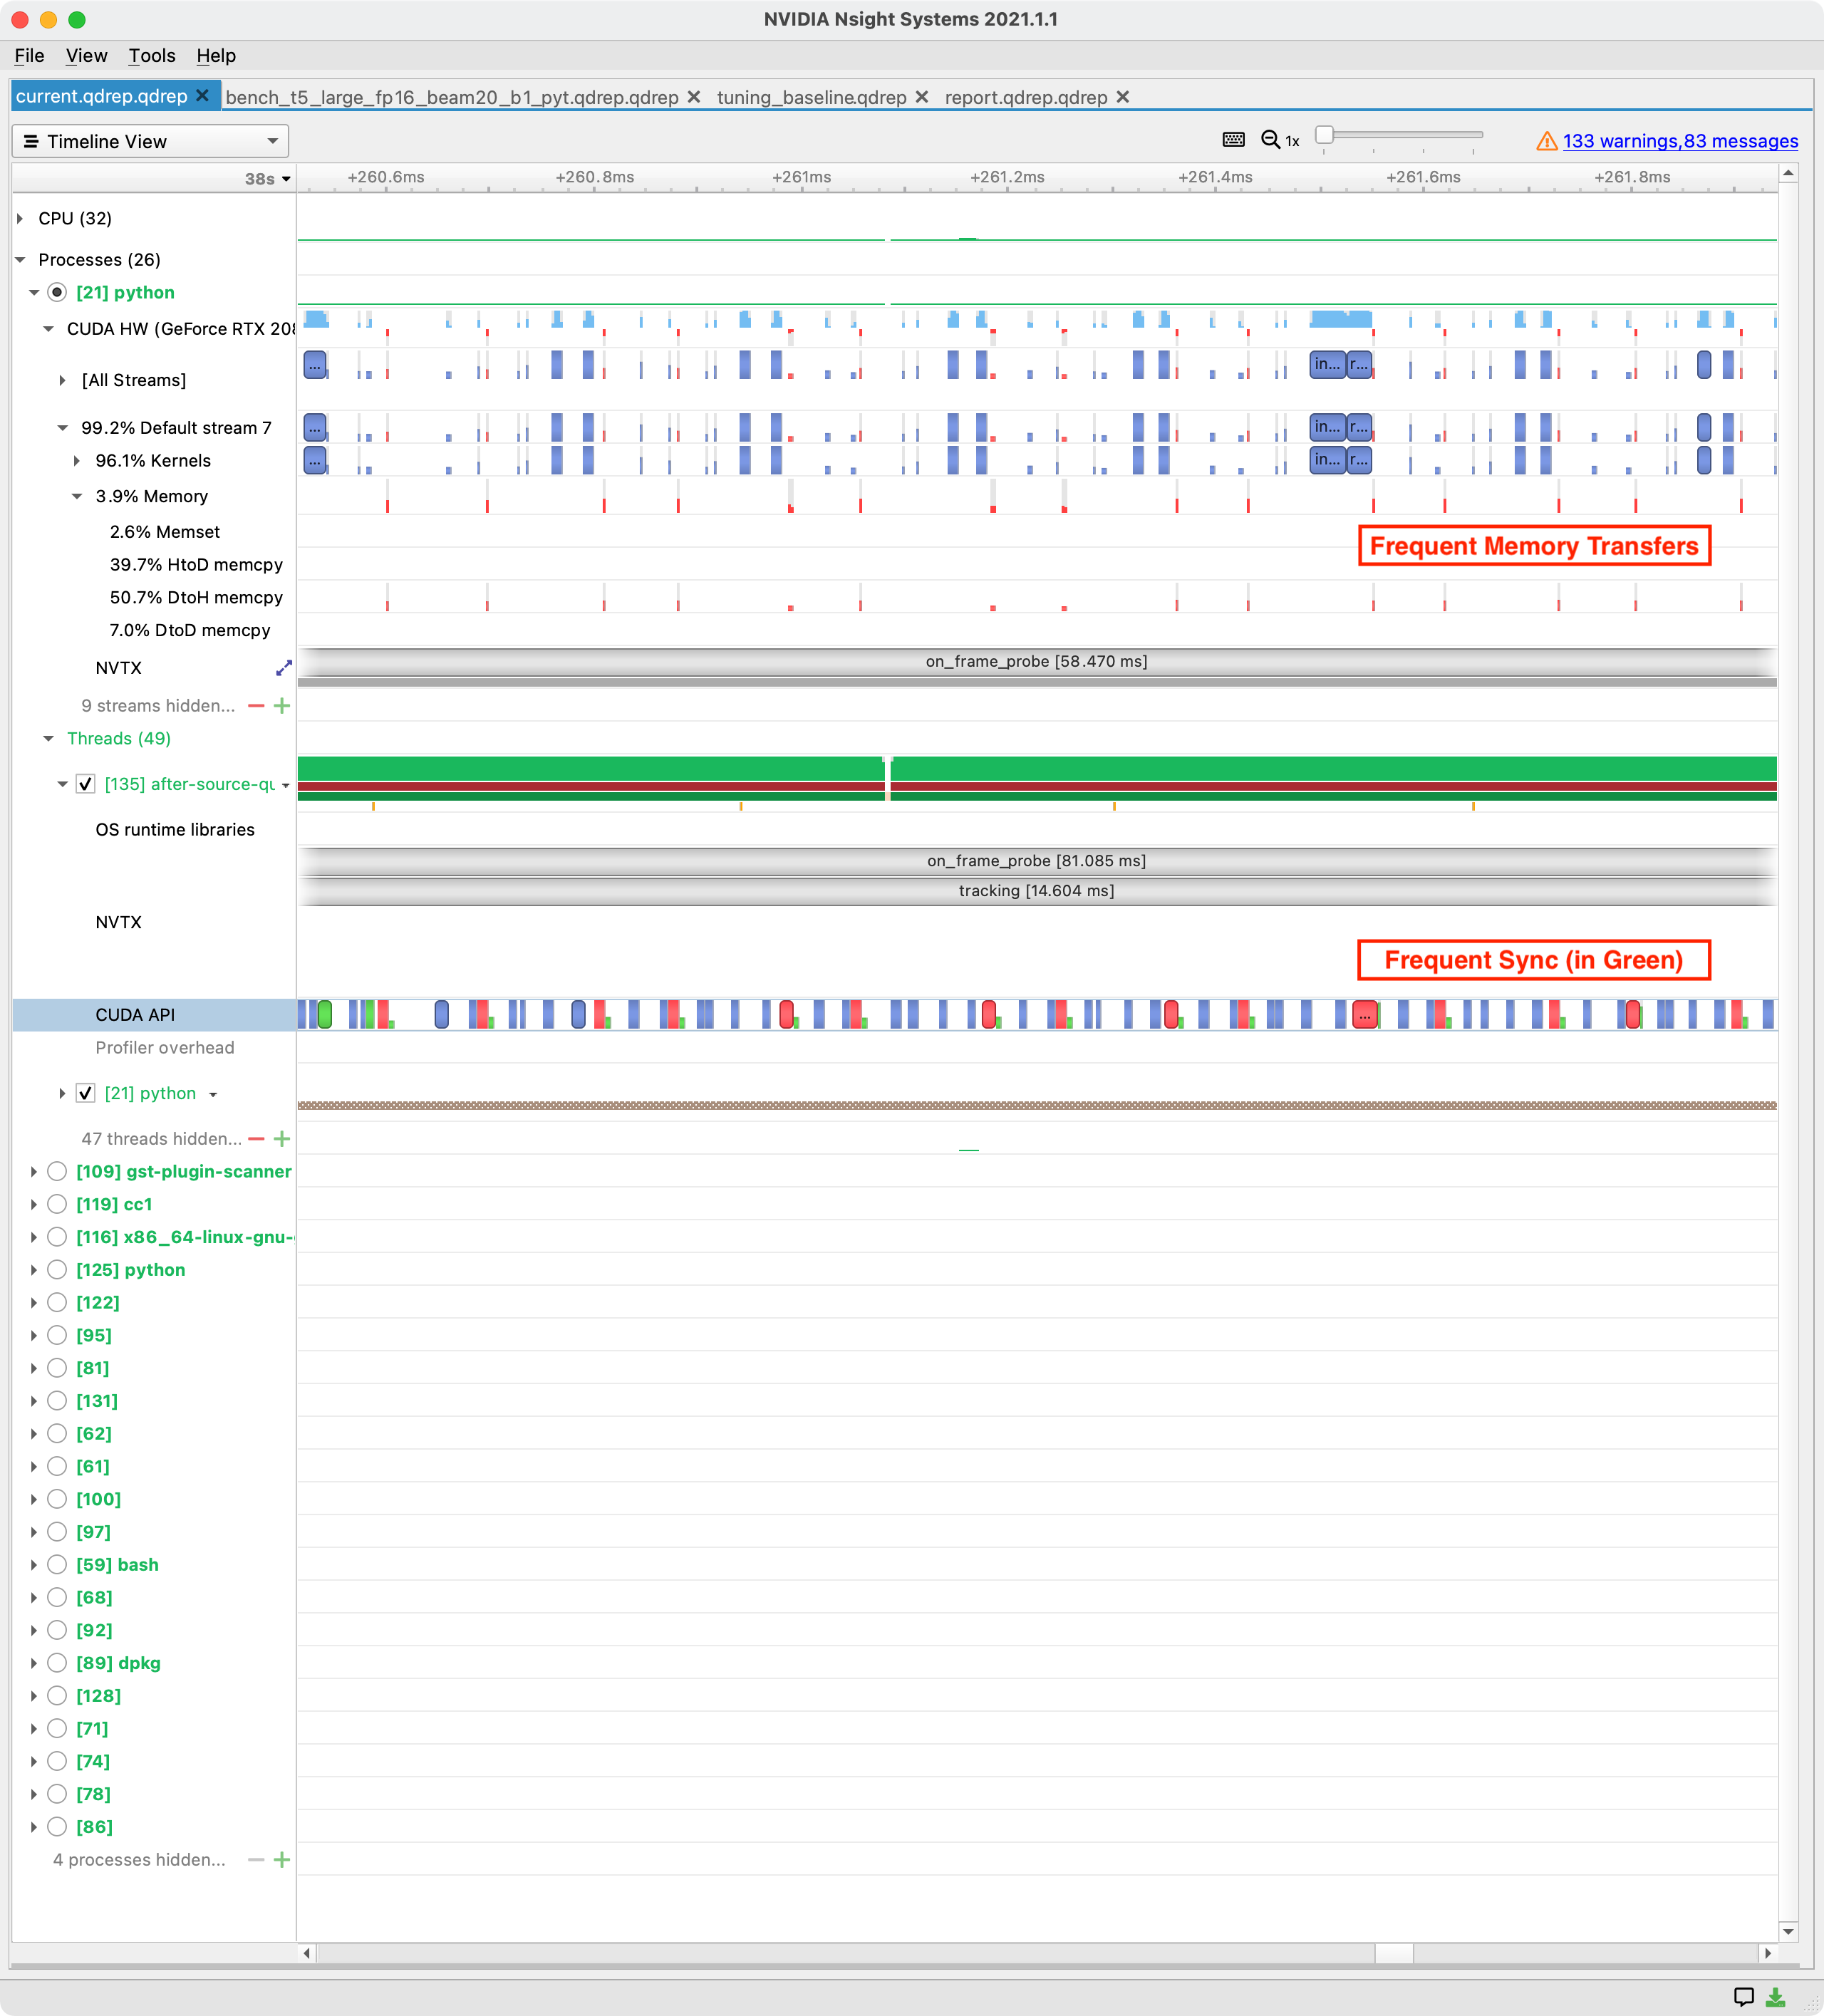
This pattern commonly occurs in conjunction with CUDA API bound code, often during post-processing where small GPU operations are mixed with dependent CPU operations. This alternating GPU/CPU computation usually requires many small memory transfers and associated syncronization points, and you pay a latency cost each time. If you are writing post-processing logic on the GPU but find yourself writing loops in host code, then you may be creating this pattern.
In this heavily zoomed-in trace, note all the green synchronization points in the CUDA API trace, and all the corresponding tiny DtoH (device to host) memory transfers. This is a classic issue with post-processing logic.
Synchronization is required when a result from either host or device is needed on the other, so the key to solving this pattern is to fix interleaved host/device computation.
Sometimes this can be done by turning loops into vectorized tensor ops on the GPU, sometimes splitting out the algorithm into batched GPU computation and subsequent looping host computation can help, and sometimes moving everything to the host comes out ahead. A low-effort fix is to increase batch sizes which proportionally reduces interleaved computation, but doesn’t fix the underlying problem.
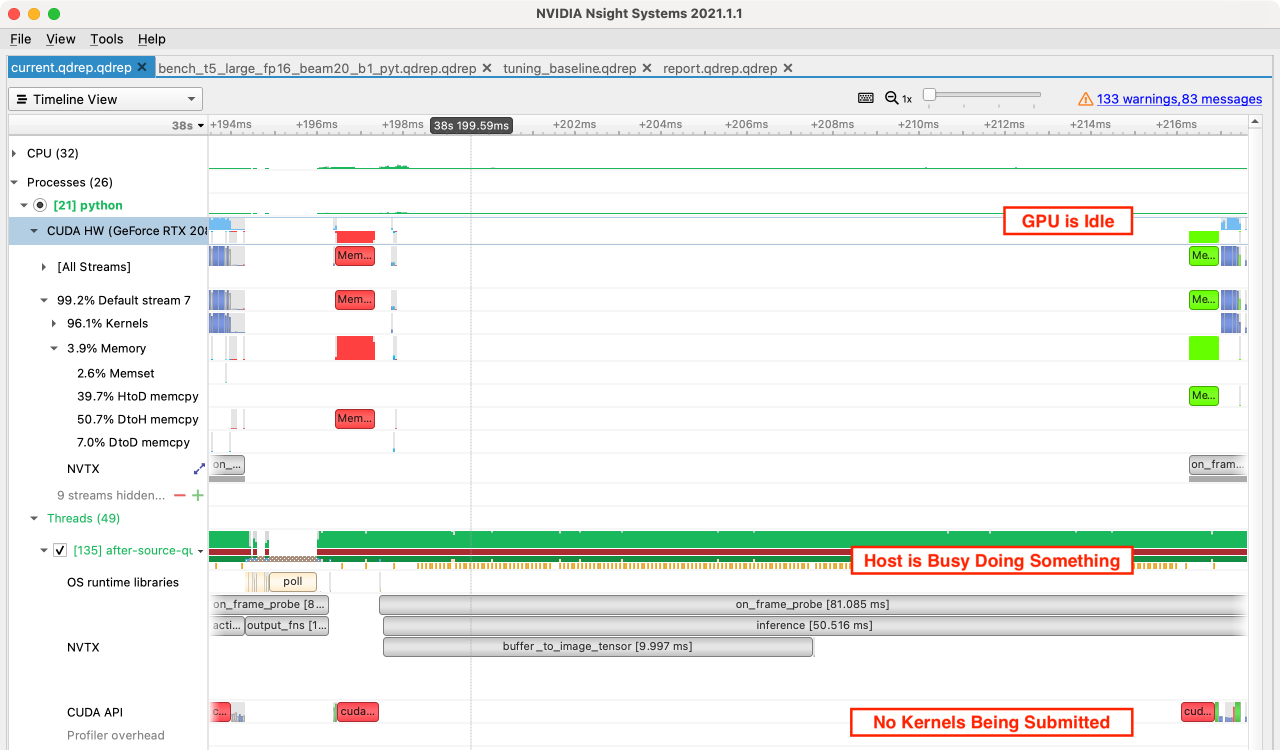
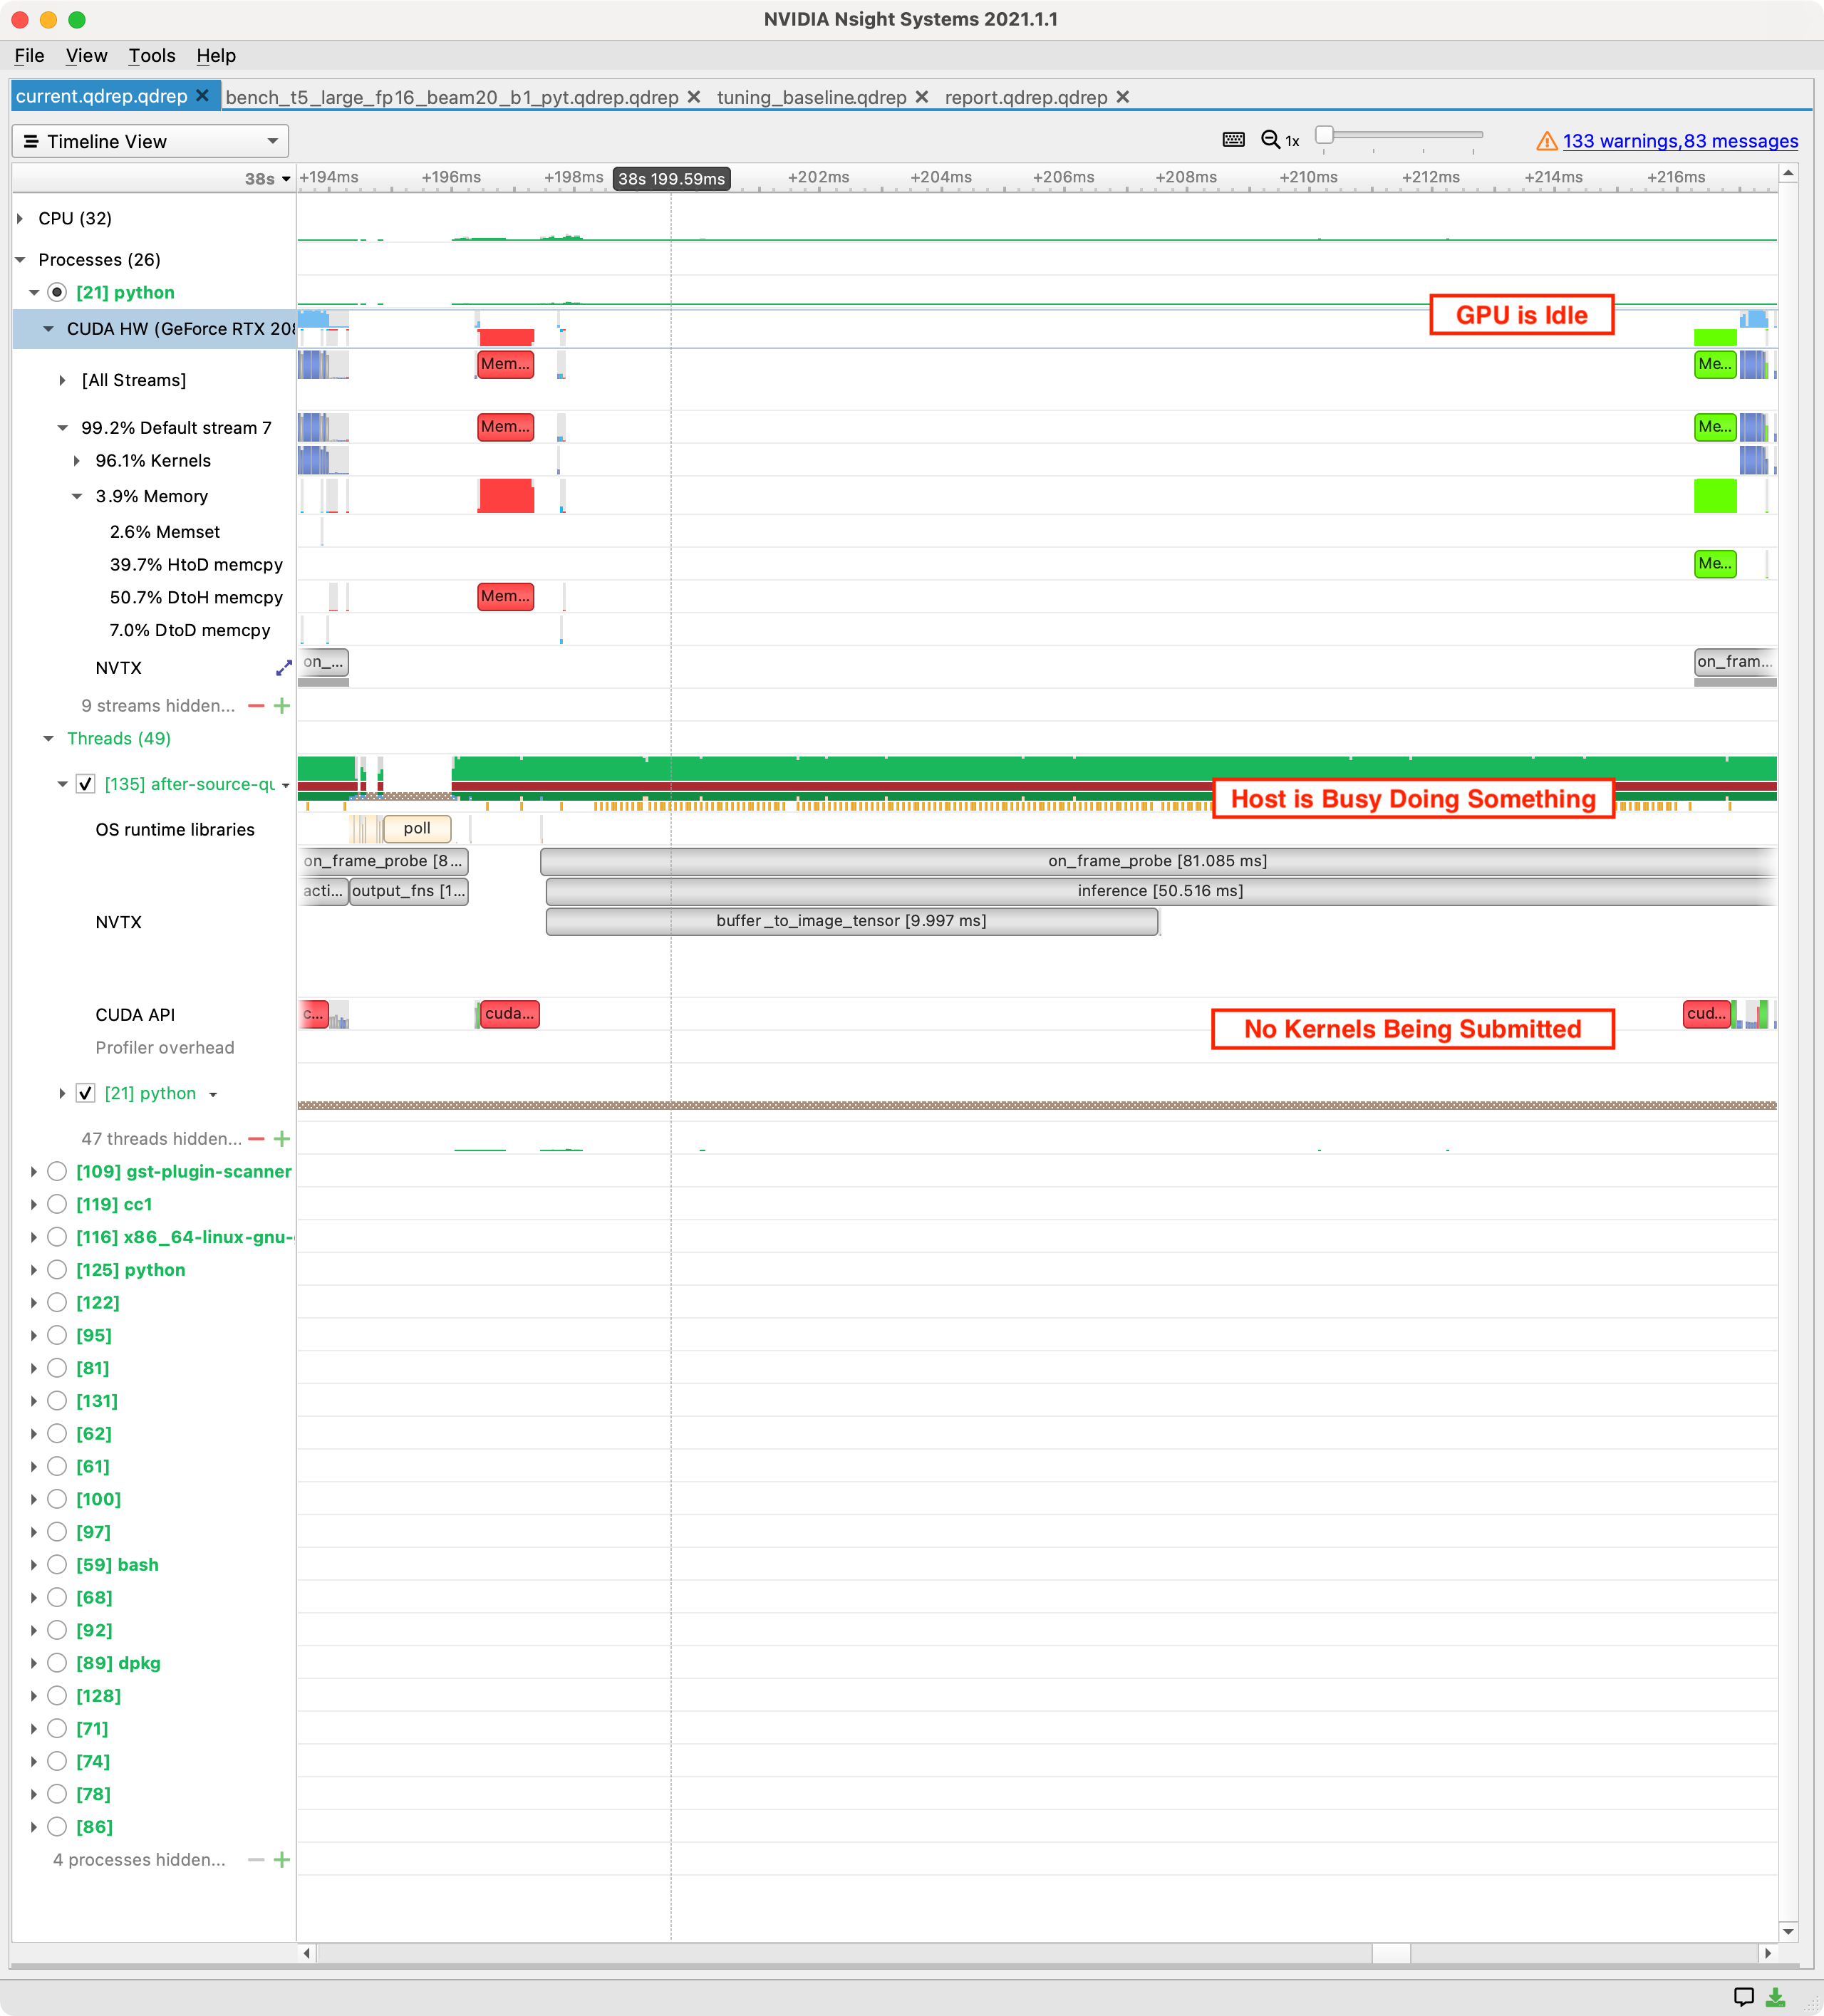
If your machine learning process is CPU compute bound then you may have a simple bug where some portion of your model code is running on CPU rather than GPU.
Legacy machine learning systems used to do preprocessing and postprocessing using CPU only — only using the GPU for the core model. We now have hardware accelerated augmentation libraries and flexible on-GPU transformation pipelines, so for either training or production inference doing substantial preprocessing or postprocessing on CPU rarely makes sense.
If you have this pattern and it was an honest mistake, I forgive you.
Move the compute to GPU by expressing the algorithm as highly vectorized tensor operations.
If work cannot be moved to the GPU, do this work asynchronously with respect to tasks which can use the GPU. ⤴️
The most important idea in this post is that of being systematic when optimizing performance — measuring and observing well-defined problems before you spend time fixing them. ⤴️