Navigating NVIDIA Nsight Systems for Efficient Profiling
Read on Omnivore | Read Original
Highlights
Nsight systems profiling command is extremely simple:
nsys profile python [INPUT_FILENAME]That’s it!
But don’t run this just yet, we have to add some flags for making the most out of our profiling:
--trace=cuda,nvtx,osrt
- Here’s what each option captures:
cuda: CUDA API Calls/CUDA kernels informationnvtx(NVIDIA Tools Extension): Custom annotations which show up in the visualizerosrt(Operations Systems Runtime): Any communications with hardware, multi-threading synchronizations, and kernel schedulers-o [OUTPUT_FILENAME]
- Custom output filename
Here’s the final template:
nsys profile --trace=cuda,nvtx,osrt -o [OUTPUT_FILENAME] python [INPUT_FILENAME]⤴️
CUDA HW: Shows GPU Utilization Ratepython(Names will vary): Shows CPU Utilization RateOS runtime libraries: Especially useful for viewing thread activities(e.g. synchronizations, semaphores, etc)CUDA API: Shows CUDA API Calls ⤴️
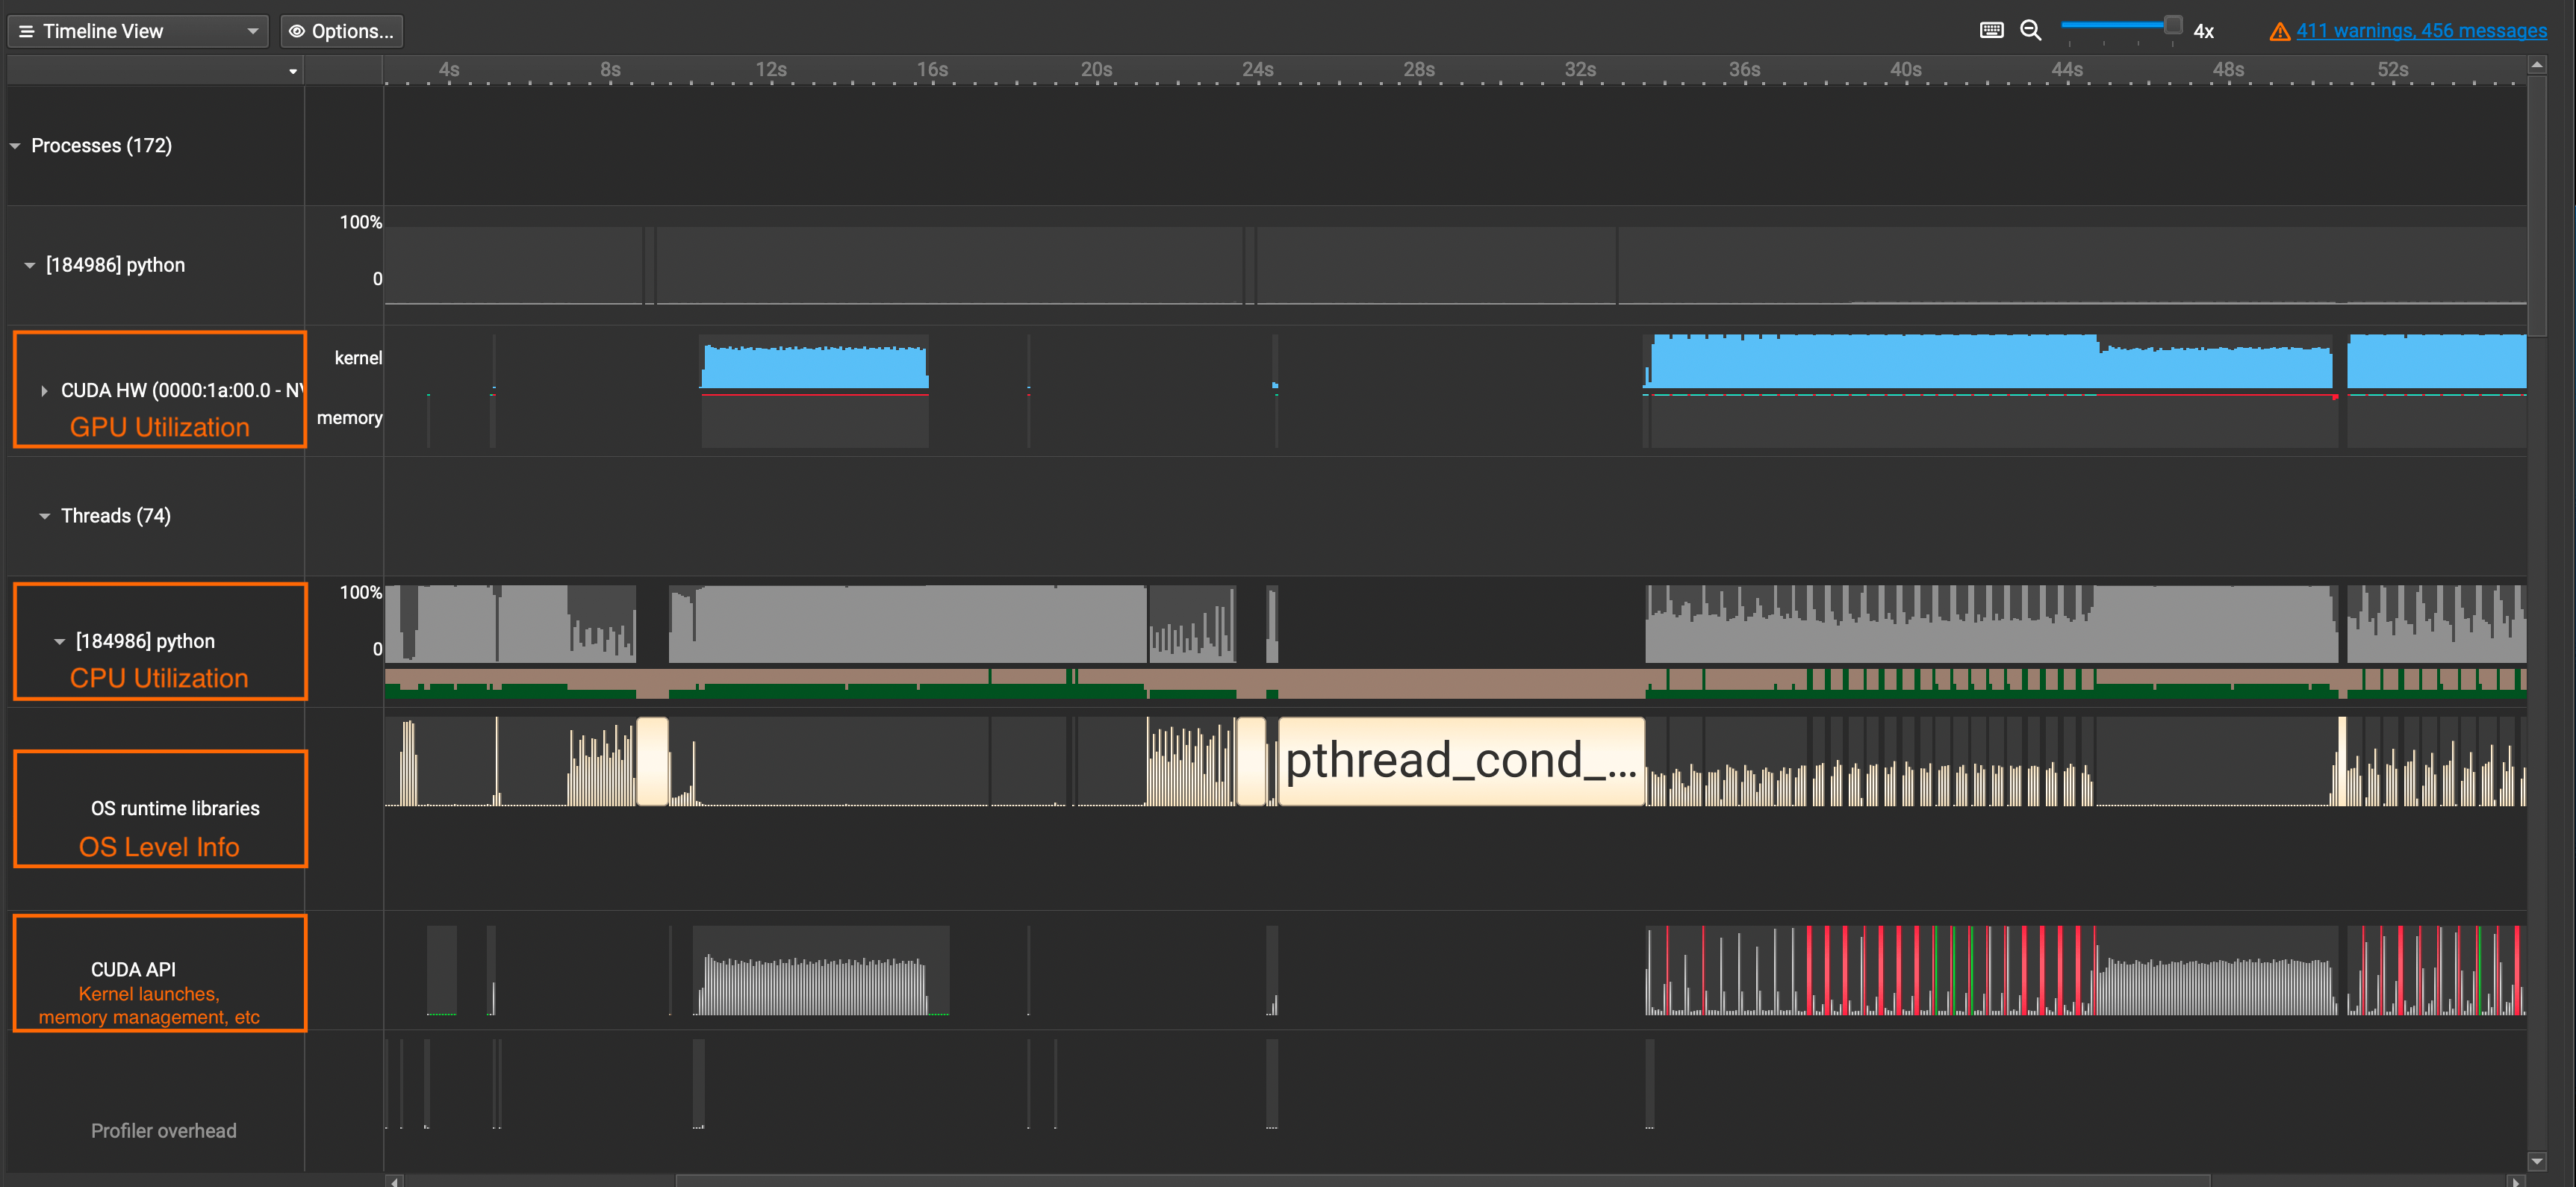
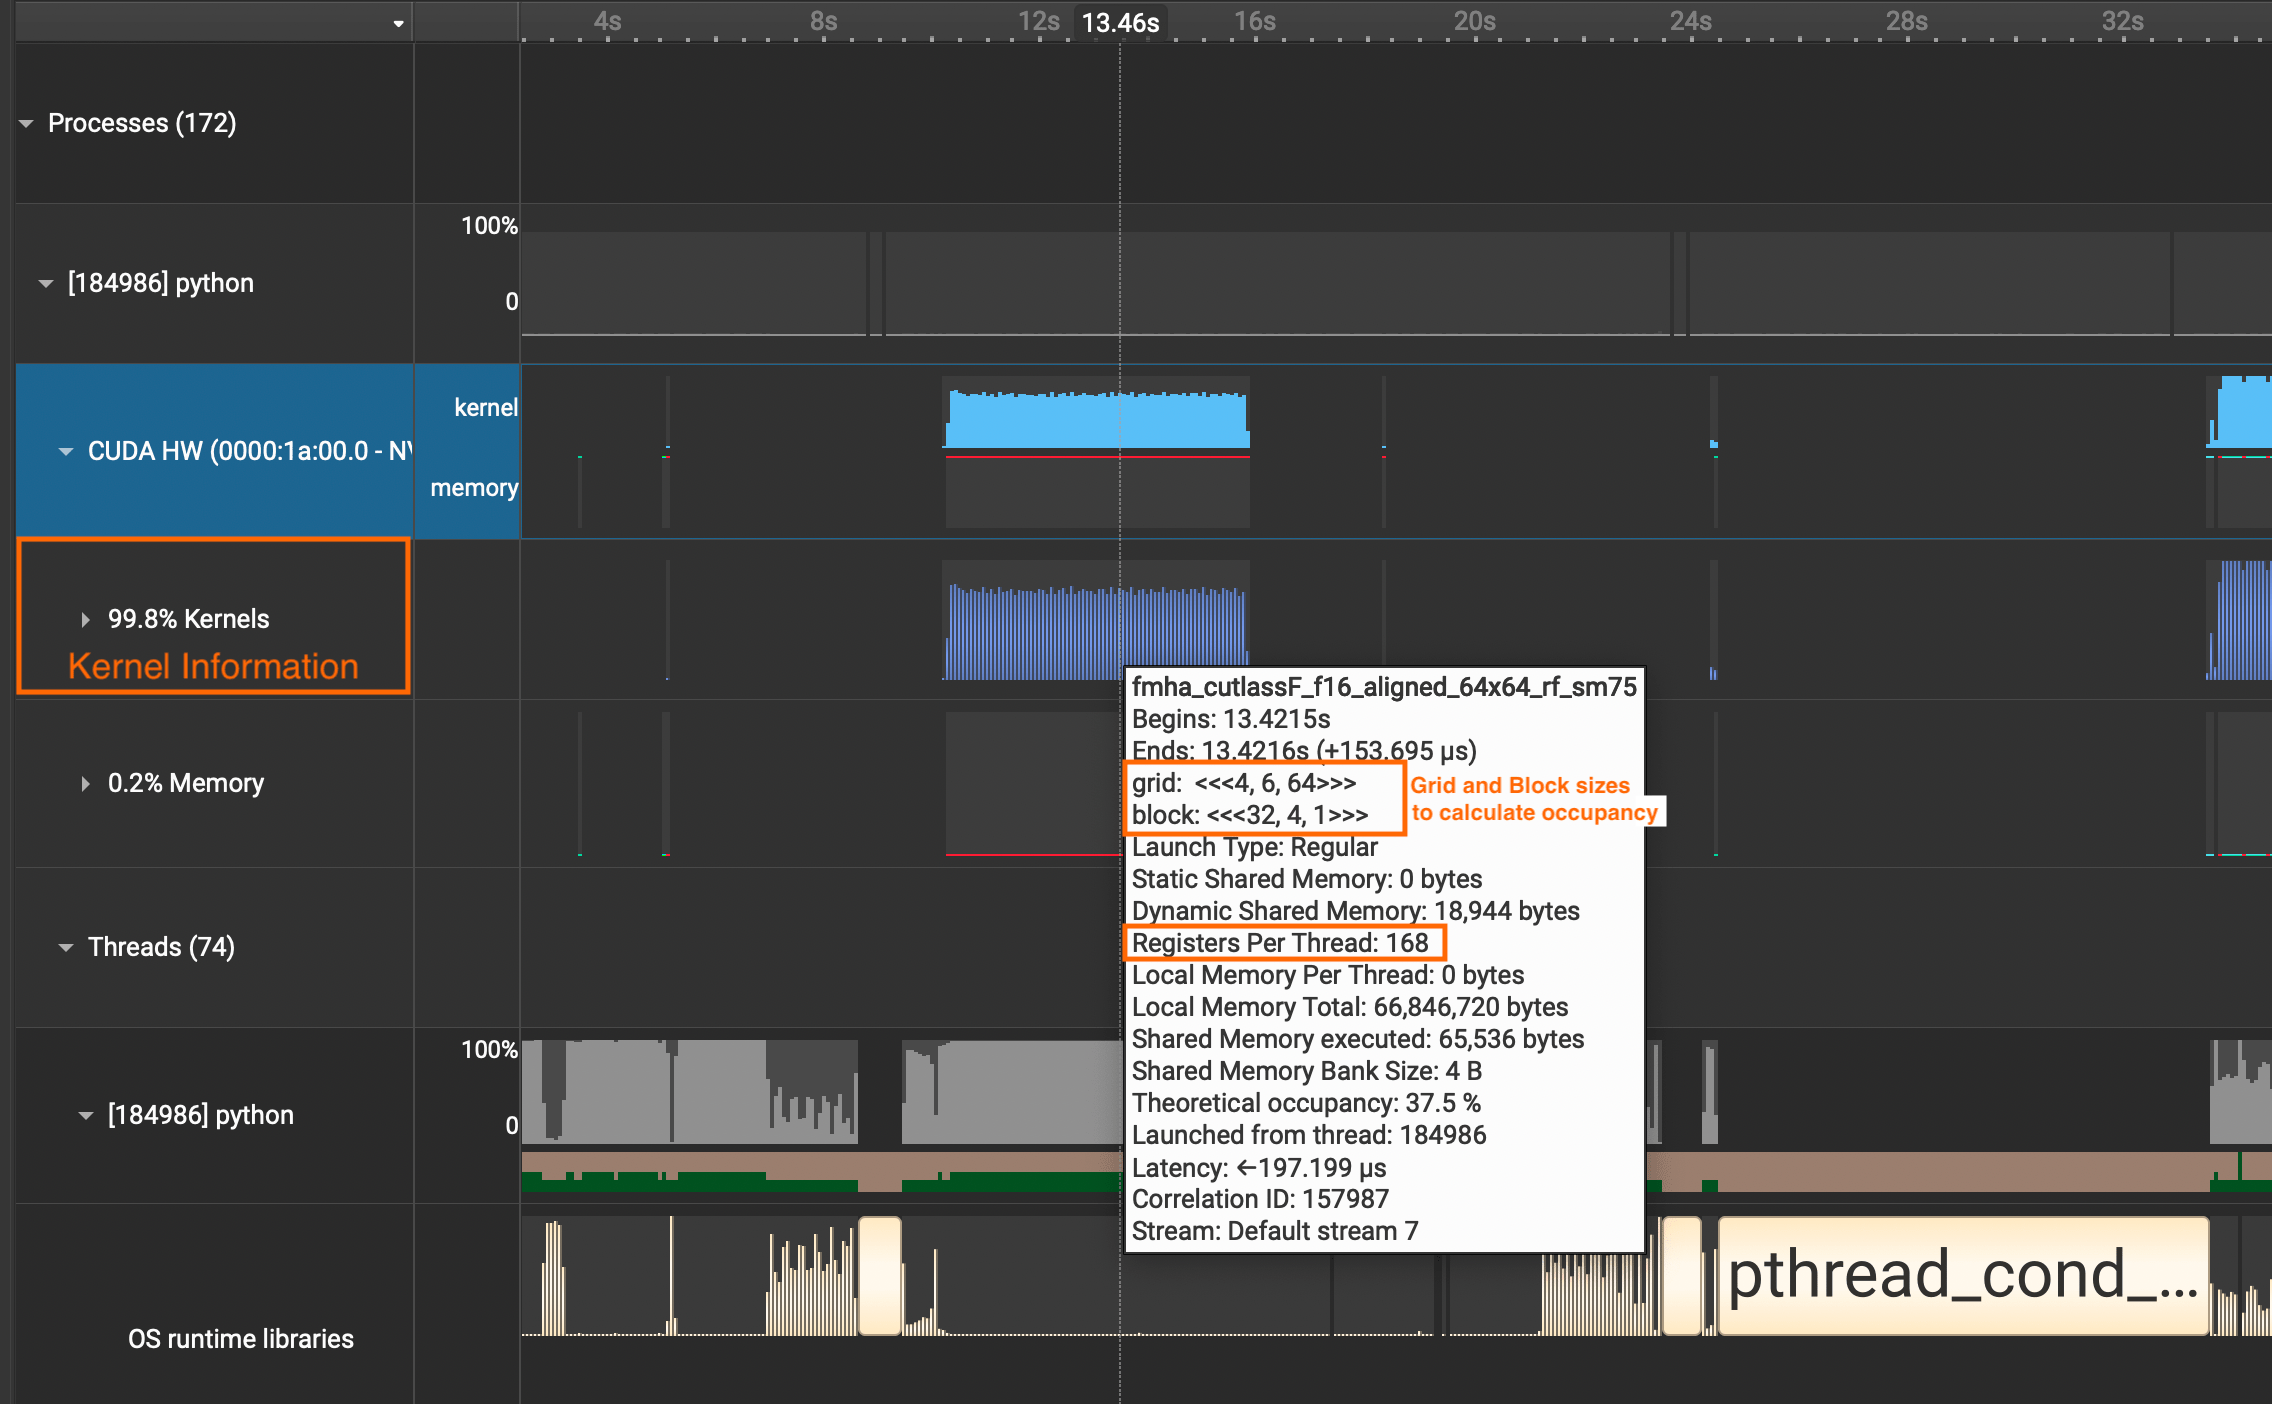
If you want to see detailed information about CUDA Kernel calls, click the
CUDA HWdropdown and see theKernelsrow. It contains information about grid sizes, block sizes, registers per thread, and such which is useful for calculating the occupancy of SMs.
We need to put the parts in our interest within the loop of
with nvtx.annotate("YOUR_COMMENT_HERE"⤴️
We now see our annotations showing up in blue in the
NVTXrow. ⤴️
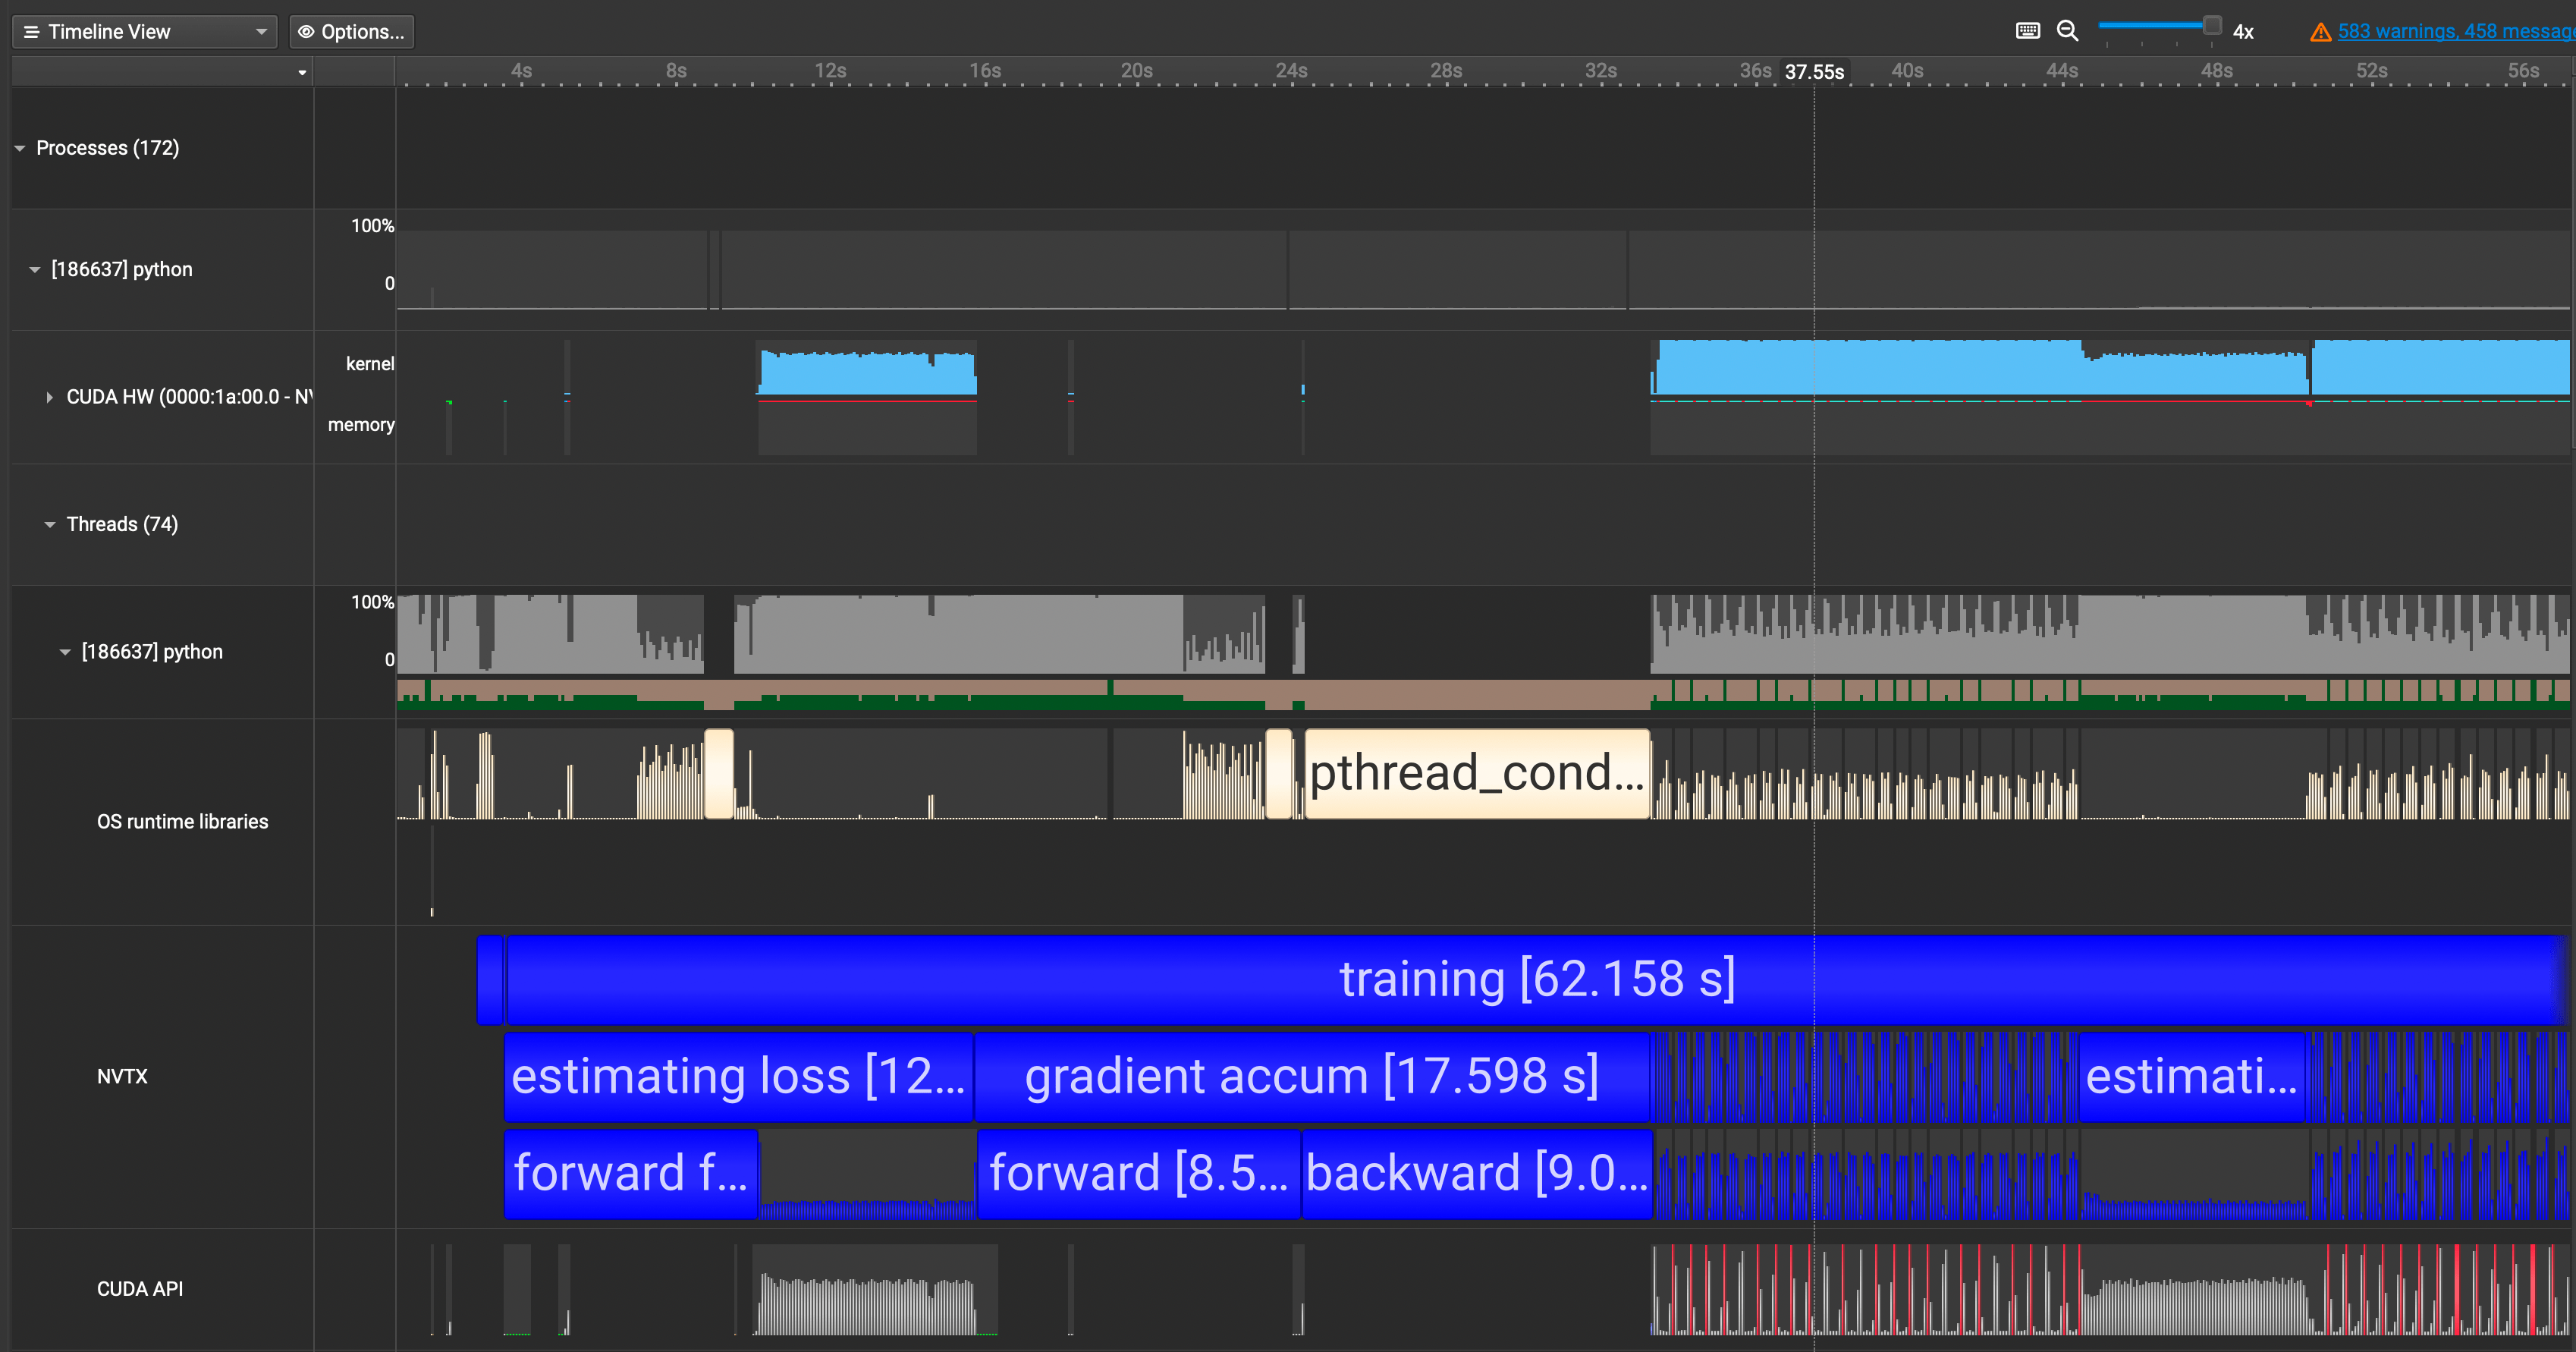
why the first pass of
forwardandbackwardcalls were not utilizing the GPU and why they were taking so long. I thought it was a small mistake on my end or with the code.When I went and did some digging, I realized this is a property of
torch.compile!torch.compilewill compile the model into optimized kernels as it executes, so naturally it will take much longer during the first run than the rest. ⤴️
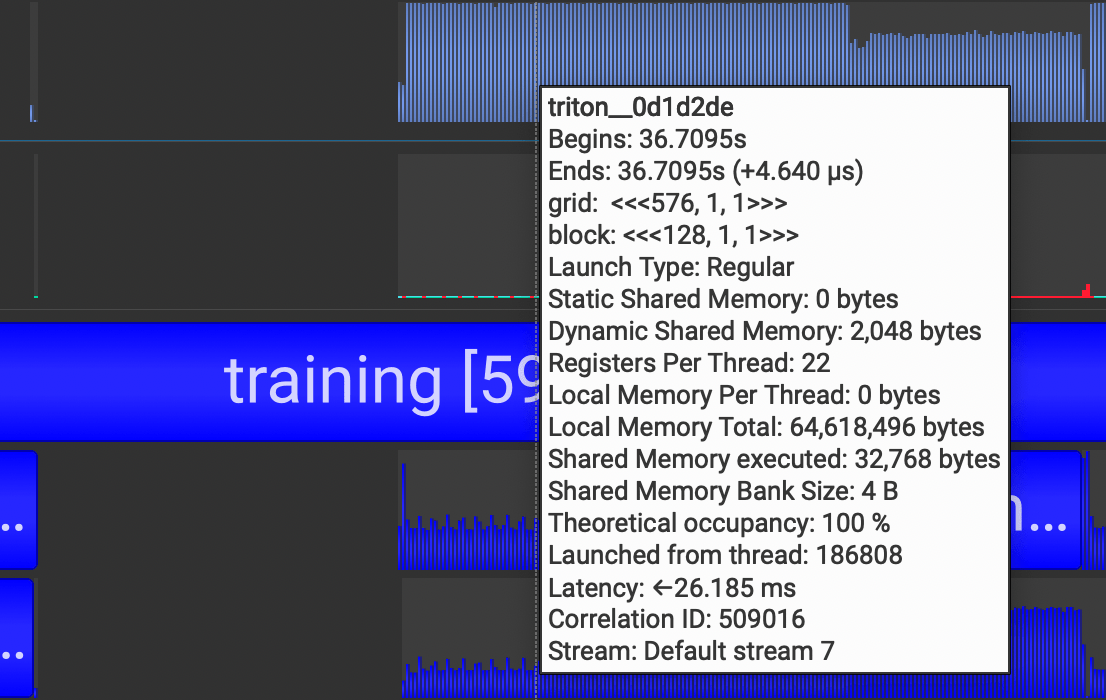
torch.compileoutputs triton kernels, which is why we see many triton kernel launches in our Nsight Systems too.
After profiling, however, is where the real work starts. You should first identify which category of bottleneck your program is facing out of these:
1. GPU Compute Bound
2. CUDA API Bound
3. Synchronization Bound
4. CPU Compute Bound ⤴️